Figures & data
Table 1. Characteristics of the patients enrolled in this study
Figure 1. Differential gene expression analysis between peripheral T lymphocytes from patients with melanoma (c) and patients with melanoma treated with AGI-101H 6 days after vaccine administration (AV) using HG U219 microarray data
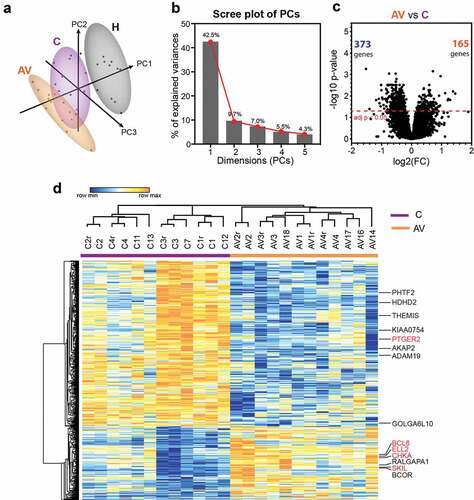
Figure 2. Significantly up-regulated markers in the peripheral T cells of AGI-101H-immunized patients are mainly involved in the regulation of gene transcription
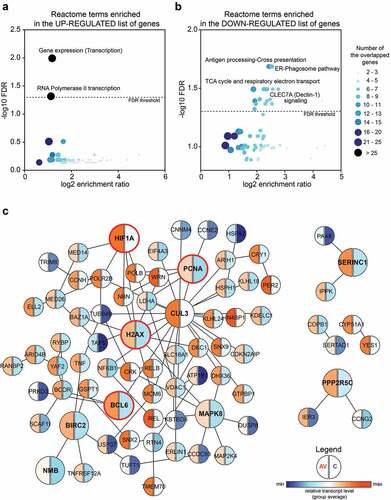
Figure 3. The expression of BCL6 transcriptional repressor is significantly up-regulated in the peripheral T cells of AGI-101 immunized patients with melanoma and negatively correlates with the expression of BCL6 target genes as well as the expression of “exhaustion markers.”
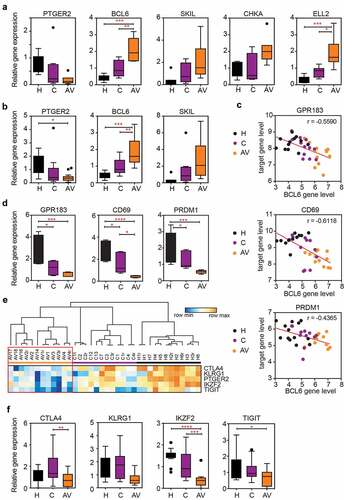
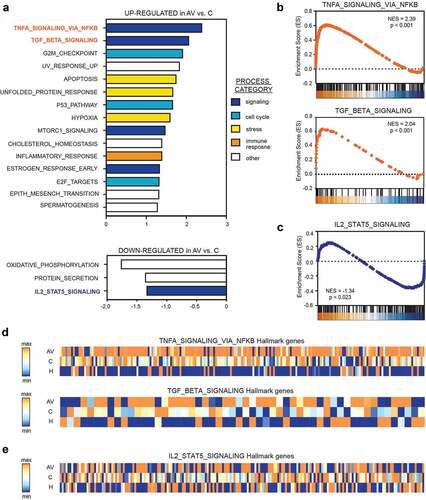
Figure 4. Gene set enrichment analysis (GSEA) revealed significant up-regulation of TNF-a (via NFkβ) and down-regulation of IL2-STAT5 signaling in the peripheral T cells from AGI-101H-vaccinated patients with melanoma