Figures & data
Figure 1. Evaluation of the potential antileukemic effect of the point-of-care approach. (a) Timeline of the experiment. NSG mice were inoculated with RS4;11 GFP tumor cells and, after 3 days, treated with CAR T cells electroporated 4 h before treatment. (b) Expression of 19BBz CAR in T cells 24 h after electroporation. Mock condition represents the electroporation of PBMC without 19BBz plasmid. (c) Animal blood was collected on day 41 for analysis of tumor burden of RS4;11 GFP by flow cytometry. (d) Kaplan-Meier plot of survival data (PBS n = 6; Mock n = 5; 19BBz n = 9). (e) After euthanasia, tumor burden in blood, bone marrow, spleen, and liver were analyzed by flow cytometry. The survival curve was analyzed by log-rank test and for organ analysis, the Mann–Whitney test was used for paired comparisons. Consider * p < .05, ** p < .01, *** p < .001
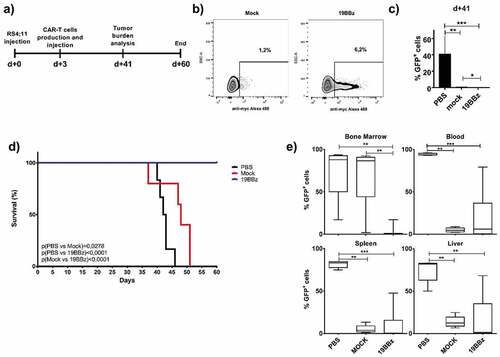
Figure 2. Comparison of antitumor activity in treated animals with cells electroporated 4 or 24 h earlier. (a) Timeline of the experiment. Animals were treated with CAR T cells from the same donor, but at different times after its production: 4 or 24 h after electroporation. (b) Immunophenotypic characterization of cells and (c) memory phenotype characterization evaluated in CD4+ and CD8 + T cells and represented by Naive (CD45RO-), Central Memory (CM, CD45RO+ and presence of either CD62L or CCR7 markers) and effector Memory (CD45RO+CD62L-CCR7-) 24 h after electroporation. (d) Expression of 19BBz CAR in T cells 24 h after electroporation. (e) Kaplan-Meier plot of overall survival data (Mock 4 h n = 5; Mock 24 h n = 6; 19BBz 4 h n = 6; 19BBz 24 h n = 6). The survival curve was analyzed by log-rank test
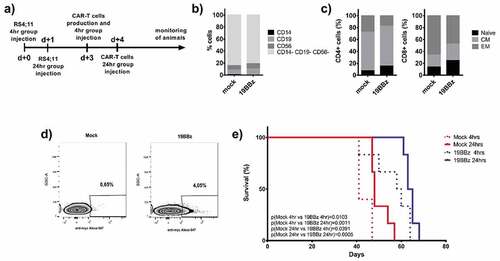
Figure 3. Effectiveness of point-of-care (POC) approach in animals engrafted with Nalm-6. (a) Timeline of the experiment. NSG mice were inoculated with 105 Nalm-6 GFP cells and were treated after 2 days with CAR T cells produced 24 h earlier. (b) Expression of 19BBz CAR in T cells 24 h after electroporation. (c) Kaplan-Meier plot of survival data (PBS n = 5; Mock n = 5; 19BBz n = 6). (d) After euthanasia, tumor burden of blood, bone marrow, spleen, and liver were analyzed by flow cytometry. The survival curve was analyzed by log-rank test and for organ analysis, the Mann–Whitney test was used for paired comparisons. Consider * p < .05, ** p < .01, *** p < .001
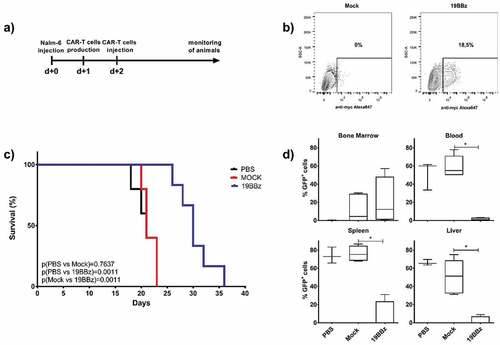
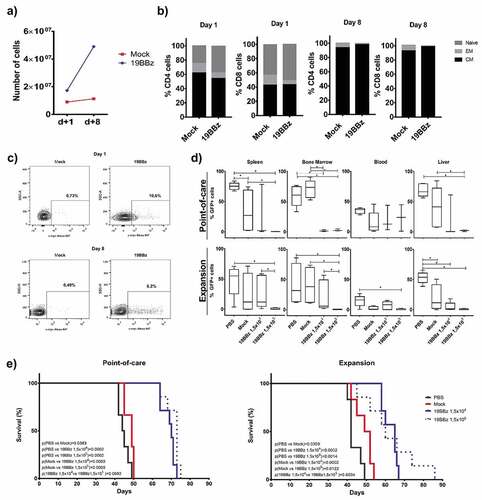
Figure 4. Comparison of the efficiency of antitumor activity between the Point-of-care approach and cells expanded with anti-CD3/CD28 coated beads. (a) Comparison of the expansion of CAR+ cells. Cells from this donor were used to treat NSG mice engrafted with RS4;11 in the POC or expanded cells approach. (b) Memory phenotype was evaluated on day 1 and day 8 after electroporation in CD4+ and CD8+T cells and was represented by Naive (CD45RO-), Central Memory (CM, CD45RO+ and presence of either CD62L or CCR7 markers) and Effector Memory (CD45RO+CD62L-CCR7-). (c) Expression of 19BBz CAR in T cells 24 h after electroporation and on day 8 of the expansion protocol. (d) Evaluation by flow cytometry of the tumor burden of the organs in the groups after euthanasia. (e) Kaplan-Meier plot of survival data (POC group: PBS n = 6; Mock n = 6; 19BBz 1,5x10⁴ n = 7; 19BBz 1,5x10⁵ n = 7. Expansion group: PBS n = 6; Mock n = 6; 19BBz 1,5x10⁴ n = 7; 19BBz 1,5x10⁵ n = 7). The survival curve was analyzed by log-rank test and for organ analysis, the Mann–Whitney test was used for paired comparisons. Consider * p < .05, ** p < .01, *** p < .001