Figures & data
Figure 1. Enhanced specific cytotoxicity by EGFR-BATs directed at pancreatic cancer cell lines after pretreatment of chemotherapeutic agents. (A)L3.6 and MiaPaCa-2 cell lines either left untreated (UT) or pretreated with IC50 doses of CIS (12.5 ng/mL), GEM (5 ng/mL), TAX(12.5 ng/mL) and PAC (10 ng/mL) for 3 days, the drugs were washed out and the surviving tumor cells were re-expanded, and tested for susceptibility for ATC and EGFR-BATs mediated killing by 51Cr release assay. There was a significant increase in the cytotoxicity mediated by EGFR-BATs against drugs (CIS, GEM, TAX, PAC) pretreated L3.6 compared to ATC mediated cytotoxicity (p < .0001). Untreated (UT) L3.6 cells served as positive control. Likewise, there was a significant increase in the EGFR-BATs mediated cytABotoxicity against MiaPaCa-2 cells pretreated with drugs (CIS, GEM, TAX, PAC) compared to ATC mediated cytotoxicity (p < .0001). (B) Shows specific cytotoxicity against GEM-, CIS-resistant, dual GEM/CIS- (first generated GEM resistance followed by inducing CIS resistance) and CIS/GEM- (first generated CIS resistance followed by inducing GEM resistance) resistant lines by ATC, EGFR- and HER2-BATs at E/T of 25:1 (n = 3) compared to parental L3.6 cell line (P). There was no difference in EGFR-BATs or HER2-BATs mediated cytotoxicity between parental and drug resistant cell lines. Cytotoxicity was significantly high when mediated by EGFR-BATs (p < .0001) or HER2-BATs (p < .0001) compared to ATC. (C)(Upper Left) Parental, CIS- (CR), and GEM-resistant (GR) L3.6 cell lines were sequentially targeted either with EGFR-BATs followed by targeting with HER2-BATs or HER2-BATs first followed by retargeting with EGFR-BATs (Upper Right panel). Data show significantly enhanced killing of both parental (p < .03) and GEM-resistant cell line (p < .004) for EGFR-BATs pretreated L3.6 cells. Sequential targeting of parental and CIS-resistant L3.6 cell lines by HER2 followed by EGFR-BATs also showed significantly high killing (p < .05). (Lower Left panel) Significantly enhanced killing of GEM- (p < .0002) and CIS-resistant (p < .0002) PANC-1 cell lines pretreated with EGFR-BATs followed by retargeting with ATC compared to untreated or ATC pretreated cells. (Lower Right panel) Comparable cytotoxicity of tumorspheres (TS) generated from parental (L3.6-TS), CIS-resistant (CR-TS), and GEM-resistant (GR-TS) cell lines when targeted with ATC, HER2-, and EGFR-BATs measured by 51Cr release assay at E/T of 25:1
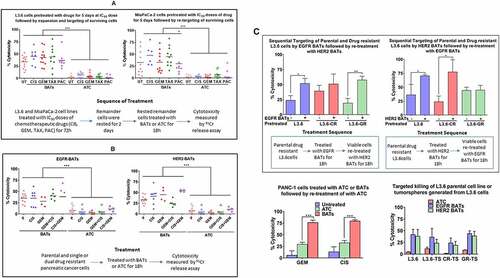
Figure 2. Chemosensitization of Pancreatic Cancer Cell Lines by BATs.(A) Cytotoxicity of PANC-1 (Upper Left), MiaPaCa-2 (Upper Right), BxPC-3 (Lower Left), and CFPAC (Lower Right) cell lines pretreated with BATs at an E/T of 2:1 followed by treatment with 25% (1/4th) of the IC50 or 50% (half) of the IC50 dose of CIS (IC50 dose for PANC-1 = 14.0 µM, MiaPaCa-2 = 18.6 µM, CFPAC = 10 µM, and BxPC-3 = 6.9 µM) measured using the RTCA system. The solid lines show priming with BATs before addition of CIS and the dashed lines show treatment with CIS without priming with BATs. BATs primed PANC-1 cells showed significantly increased specific cytotoxicity after adding CIS at all doses 3.5 µM (25% of IC50 dose) (p < .002), 7.0 µM (50% of IC50 dose) (p < .004), and 14 µM (IC50 dose) (p < .05) at 72 hours (Upper Left panel). Specific cytotoxicity increased significantly (p < .047) in BATs primed MiaPaCa-2 cells treated with IC50 dose of CIS compared to CIS alone treated MiaPaCa-2 cells (Upper Right panel). In BxPC-3 cells, priming with BATs before the addition of CIS significantly increased specific cytotoxicity with 25% (p < .05) and 50% (p < .045) of IC50 dose doses of CIS at 72 hours, however, there was no significant difference in cytotoxicity in BATs primed or not primed MiaPaCa-2 cells at IC50 dose of CIS (Lower Left panel). In CFPAC cells, priming with BATs before the addition of CIS significantly increased specific cytotoxicity at 72 hours with 25% of IC50 dose (p < .05) of CIS compared to CIS treated CFPAC cells without BATs priming (Lower Right panel). Cytotoxicity by CIS treatment increased in all four cell lines tested when primed with BATs compared to non-primed cells. (B) Shows the cytotoxicity at 25% and 50% of IC50 doses and at IC50 dose of CIS for CIS-resistant PANC-1 (PANC1-CR) and CIS-resistant MiaPaCa-2 (MiaPaCa-2-CR) cell lines primed with BATs
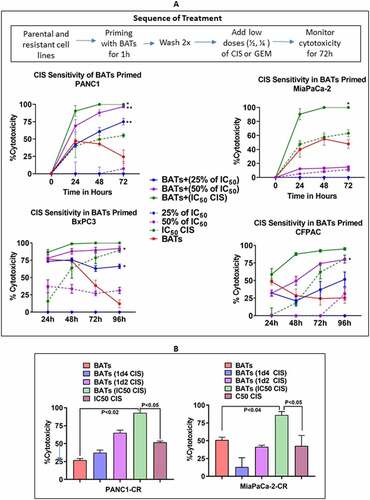
Figure 3. Drug Resistance Associated Cancer Stem-like Cells. (A) Representative images of parental MiaPaCa-2 and its CIS- or GEM-resistant cell lines are shown, each cell type is represented by a column of three sets of images simultaneously acquired in ImageStreamx flow cytometry using ImageStreamX System. Middle panel highlighted by red box show CD44+/CD24+/HER2+ cancer stem like cells in GEM-resistant and CIS-resistant lines compared to parental cell line missing HER2 expression in CD44+/CD24+ population. From left to right: bright field (gray), CD44-FITC (green), CD24-PerCp Cy5.5 (Red) and HER2 PE (Yellow) for MiaPaCa-2 parent (Left panel) and drug resistant lines (GEM-resistant in Middle and CIS-resistant in Right panels). A panel below is the screen-capture of the IDEAS analysis showing differential dot plot representing CD44+/CD24+ for parent (Left panel) and drug resistant derivatives of MiaPaCa-2 (Middle and Right panels). (B) Shows the staining for ABCG2 gated on EpCam+/CD44+/CD24+ cells of parental, CIS-, and GEM-resistant L3.6 and MiaPaCa-2 cell lines
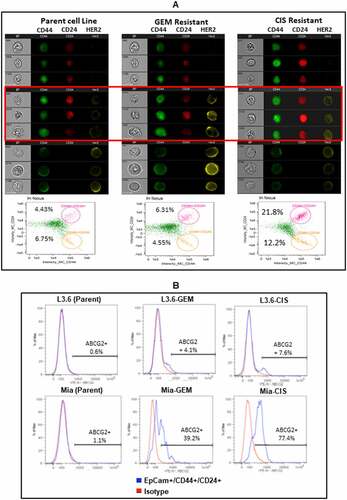
Figure 4. Changes in drug efflux transporters in primed PANC-1 and MiaPaCa-2 cell lines by Flow Cytometry. (A) Staining for MRP-1 (ABCC1), ABCG2, MDR-1 (ABCB1), and ABCB5 drug efflux transporters in parental PANC-1 and MiaPaCa-2 cell lines and their CIS-resistant (CR) derivatives (Top panel). CR cells showed significantly increased MFI of MRP-1 (p < .004), ABCG2 (p < .002), MDR-1 (p < .001), and ABCB5 (p < .001) compared to CIS-sensitive parental PANC-1 cells. CR MiaPaCa-2 (MiaPaCa-2-CR)also showed significantly increased MFI of MRP-1 (p < .004) and ABCG2 (p < .04) compared to CIS-sensitive parental MiaPaCa-2 cells. (Middle and Bottom panelsB Differential expression of MRP-1, ABCG2, MDR-1, and ABCB5 in BATs primed PANC-1 and MiaPaCa-2 cells. BATs primed PANC-1 cells showed slight reduction in all four transporter pumps but the difference was not statistically significant. BATs primed CR PANC-1 (PANC1-CR) showed significantly reduced MRP-1 (p < .003), ABCG2 (p < .05), and MDR-1 (p < .04) compared to CIS-sensitive parental PANC-1 cells while ABCB5 slightly increased. BATs primed MiaPaCa-2 parental and Mia-CR showed no change in MRP-1, ABCG2, MDR-1, and ABCB5 expression. (B) Rhodamine 123 uptake assay. Parental and CIS-resistant PANC-1 and MiaPaCa-2 pancreatic cancer cell lines primed with BATs show high cellular uptake and retention of Rhodamine 123 compared to unprimed (UP)parental and CIS-resistant PANC-1 (Left panel) and MiaPaCa-2 (Right panel) cell lines. High fluorescence (elevated MFI) after priming with BATs suggest decreased activities of efflux transporters, MRP-1, and MDR-1
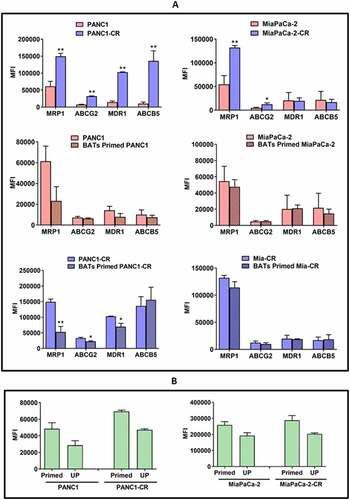
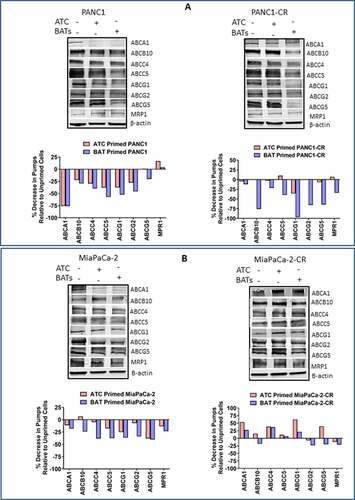
Figure 5. Western Blot Analysis for ABC Trasporter Pumps. (A) Expression of ABCA1, ABCB10, ABCC4, ABCC5, ABCG1, ABCG2, ABCG5, and MRP-1 efflux transporters in unprimed or BATs/ATC primed parental (Top, Left panel) and CIS-resistant PANC-1 (Top, Right panel) pancreatic cancer cell lines. (Bottom panels) Percent decrease in efflux transporters in ATC or BATs primed PANC-1 or ATC or BATs primed PANC1-CR pancreatic cancer cell lines relative to unprimed cancer cells. (B) Expression of ABCA1, ABCB10, ABCC4, ABCC5, ABCG1, ABCG2, ABCG5, and MRP-1 efflux transporters in unprimed or BATs/ATC primed parental (Top, left panel) and CIS-resistant MiaPaCa-2 (Top, Right panel) pancreatic cancer cell lines. (Bottom panels)Percent decrease in efflux transporters in ATC or BATs primed MiaPaCa-2 or ATC or BATs primed MiaPaCa-2-CR pancreatic cancer cell lines relative to unprimed cancer cells. Lanes, left to right: Lane 1, corresponding parental or resistant cell line; lane 2, ATC primed cell line; lane 3, BATs primed cell line for all four blots. For quantitative western blot analysis, data was normalized with β-actin for equal loading of proteins, relevant bands were cropped to combine into single figure