Figures & data
Figure 1. Expression of CEACAM6 in cancerous tissues and blood cells. A. CEACAM6 expression in tissue sections of solid tumors as detected by immunohistochemistry with mAb 9A6. CRC, colorectal carcinoma; NSCLC, non-small cell lung adenocarcinoma. B. Prevalence (%) of CEACAM6 expression in various cancer types as categorized by H-scores. H-score was calculated as 3 x (% tumor cells of staining intensity 3) + 2 x (% tumor cells of staining intensity 2) + 1 x (% tumor cells of staining intensity 1), range 0–300. ADC, adenocarcinoma; G-E, gastroesophageal; HNSCC, head and neck squamous cell carcinoma; RCC; renal cell carcinoma; SCC, squamous cell carcinoma. C. Comparison of CEACAM6 and PD-L1 expression in NSCLC (n = 50) as determined by H-scores. Using a 5% positivity cutoff for both parameters (CEACAM6-positive ≥ 5%; PD-L1-negative ≤ 5%), 26% of tumor samples can be considered positive for both targets. D. Representative histograms of CEACAM6 expression on dissociated CRC (samples #1 and #3) and NSCLC (samples #2 and #4) tumor cells as detected by flow cytometry using a phycoerythrin (PE)-labeled anti-CEACAM6 antibody 9A6. Cells were gated according to cell-specific surface markers: epithelial cellular adhesion molecule (EpCAM, clone HEA-125, Miltenyi #130–098–113) for tumor cells), CD45 (clone H130, BioLegend, #304036) for leukocytes, CD14 (clone M5E2, BioLegend, #301830) for monocytes and macrophages, CD3 (clone SK7, BD Pharmingen, #560275) for T cells, and CEACAM8 (CD66b, clone G10F5, BioLegend #305107) for granulocytes.
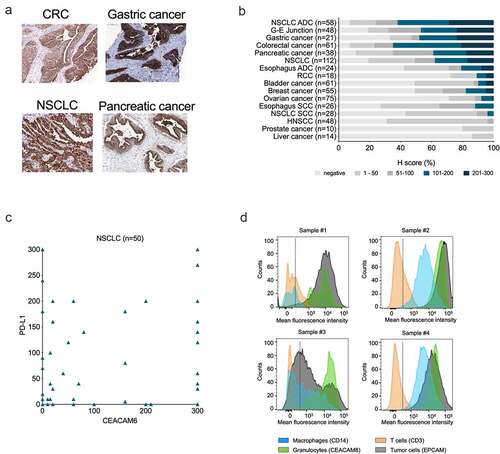
Figure 2. CEACAM6 expression in tumor cells abrogates cytolytic capacity of tumor-infiltrating lymphocytes (TILs). 9A6 was used as the CEACAM6-specific antibody and scrambled, nonspecific RNA (scr) in (a-g) and an isotype control antibody in (h) were used as controls. A. Reduction of luciferase signal upon transfection with a mixture of siRNAs inducing cell death (siCD), ubiquitin C (UBC, a gene essential for cell survival), and firefly luciferase (siFLuc) in PANC-1-luc pancreatic cancer cells. Analysis was performed by a luciferase-based viability assay. B.-D. Effect of siRNA knockdown of CEACAM6 on T cell-mediated killing of (b) KMM-1-luc multiple myeloma, (c) PANC-1-luc, and (d) NCI-H23-luc NSCLC cancer cells. Cells were co-cultured with or without matched cytotoxic TILs and cancer cell survival was determined by measuring the remaining luciferase activity after 20 h. E.-F. Effect of siRNA knockdown of CEACAM6, PD-L1, RCAS-1, or GAL-3 on T cell-mediated killing of (e) NCI-H23-luc and (f) PANC-1-luc cancer cells. The experiment was conducted as in (b-d). G. Effect of siRNA knockdown of CEACAM6 or PD-L1 on T cell-mediated killing of PANC-1 cancer cells after a 6-h co-culture as determined by a chromium release assay. H. Effect of CEACAM6 blocking by anti-CEACAM6 antibody 9A6 on T cell-mediated killing of PANC-1 cancer cells after a 6-h co-culture as determined by a chromium release assay. Untreated wild-type PANC-1 cells and an isotype antibody were used as controls. Graphs show representative data of at least two independent experiments. Statistical analyses were performed using a linear model using weighted least squares that a had separate variance term for each group (a, b, d, e); ANOVA with homogeneous variance across all groups (c); pair-wise comparisons using Welch’s t-test and Bonferroni correction (f); or linear regression using log2 of ratio as a covariate (g, h). Stars denote statistically significant differences in comparison to control or vehicle. ***, p < .001. NSCLC, non-small cell lung carcinoma; RLU, relative light unit; siRNA, small interfering RNA; TIL, tumor-infiltrating lymphocyte.
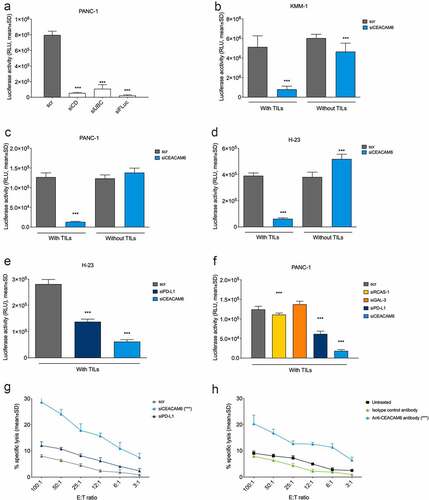
Figure 3. Antibody-binding profile of BAY 1834942 as determined by ELISA and flow cytometry. A. Binding of BAY 1834942 to recombinant human and cynomolgus CEACAM6 that were coated on a CM5 sensor chip and analyzed by SPR. B. Selective binding of BAY 1834942 to recombinant human CEACAM6 and cynomolgus monkey CEACAM6 with absence of reactivity to human CEACAM1, −3, or −5 as determined by binding ELISA. C-D. Binding of BAY 1834942 and of a control antibody 9A6 (as huIgG2) to HeLa cells transfected with (b) human and (c) cynomolgus monkey CEACAM6 as determined by flow cytometry. No binding of BAY 1834942 was observed on HeLa wild-type cells. E. The half-maximal binding (EC50) values for BAY 1834942 and the positive control antibody 9A6 as determined by binding to CEACAM6-positive cancer cells by flow cytometry. F. Dose-dependent binding of recombinant CEACAM6-Fc to recombinant human CEACAM1 (coated to plate, 1 µg/mL) by ELISA. Human IgG antibody as Fc-control is shown on the right. G. BAY 1834942 and 9A6, added as precomplex of recombinant CEACAM6-Fc (2 µg/mL) and antibody in concentration series from 0.01–100 nM at 25°C for 1 h, interrupted the interaction between CEACAM1 (coated to plate, 1 µg/mL) and recombinant CEACAM6-Fc as determined in a competition ELISA assay. For detection of bound CEACAM6-Fc in the presence of BAY 1834942, an anti-human IgG horseradish peroxidase (HRP) conjugate was used with Amplex Red (Life Technologies) as substrate. RFU, relative fluorescence unit.
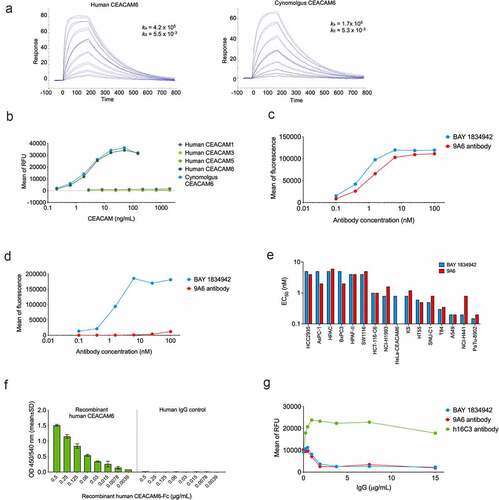
Figure 4. Immunosuppression and efficacy of BAY 1834942 correlates with receptor density and is dose dependent. A-D. BAY 1834942-induced (30 µg/mL) increase in IFN-γ cytokine release in co-culture assays of 10,000 (a) SNU-C1 colon, (b) NCI-H1993 lung, (c) KS22.24 breast, or (d) CEACAM6-transfected HCT-116 colon cancer cells and 20,000 survivin T cells. Representative examples are shown in the figure. Full data set shown in . IFN-γ levels were measured by ELISA and fold change in the induction of IFN-γ levels over background is indicated with an arrow. The data were normalized to the mean of the isotype control-treated group. E. CEACAM6 expression in SNU-C1, NCI-H1993, KS22.24, and CEACAM6-transfected HCT-116 cells as analyzed by flow cytometry and presented as mean fluorescence intensity (MFI) after binding of CEACAM6 mAb (murine IgG2a variant of BAY 1834942 for use with the Qifi kit (Dako)). Full data set shown in . F.-H. Examples of dose-dependent cytokine secretion in co-culture of 10,000 (f) KS breast cancer, (g) HCC2935 lung cancer, and (h) CEACAM6-transfected HCT116 colon cancer cells with 20,000 survivin T cells. BAY 1834942 and isotype control antibody were used at concentrations ranging from 0.6 ng/mL to 30 µg/mL. IFN-γ levels were measured with ELISA. I.-J. Effect of BAY 1834942 on the killing of HCC2935 lung cancer cells by TILs isolated from pancreatic cancer patients. EpCAM/CD3 bispecific antibody construct (0.25 ng/mL) was used as a T cell-engaging molecule and tumor cell killing was measured by loss of impedance with an Xcelligence instrument. (i) Co-culture of 10,000 HCC2935 tumor cells and 50,000 TILs (TIL-12) with BAY 1834942, 9A6 anti-CEACAM6 mAb (huIgG2 variant), anti-PD-L1 antibody (huIgG2 variant) and isotype control used at 30 µg/mL. (j). Same co-culture as in (i) with BAY 1834942 used at doses 0.02–50 µg/mL and isotype control antibody (50 µg/mL) as a control. Statistical analysis in (a-d) was performed in comparison to the isotype control group using a linear model and corrected for family-wise error rate using Sidak’s method. ***, p < .001.
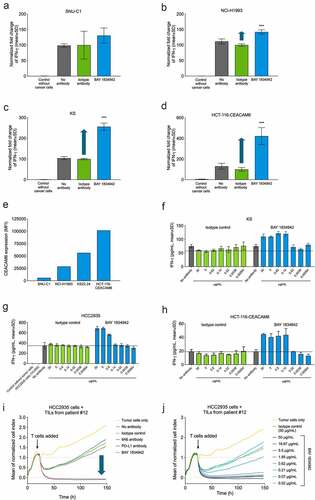
Table 1. Correlation of BAY 1834942 induced IFN-γ secretion with CEACAM6 expression in various human cancer cells, as determined by cytokine release assays on co-cultures with cancer cells (10,000 cells) and survivin T cells (20,000 cells)
Figure 5. Immunomodulatory characteristics of BAY 1834942. A. Analysis of CEACAM1, -5, -6, and -8 receptor expression on survivin T cells and virus-specific T cells by flow cytometry using anti-CEACAM1 (TPP-3006) and anti-CEACAM6 (BAY 1834942). All other antibodies as listed in Suppl. Table S1. B. Effects of combined antibody-mediated blockade of CEACAM6 and CEACAM1 on IFN-γ cytokine secretion. Co-culture of 10,000 FluM1 peptide-loaded HCC2935 cancer cells with 20,000 FluM1-specific T cells for 20 h. BAY 1834942 and CEACAM1 antibody (TPP-3006) were used at 30 µg/mL. In combination experiments, BAY 1834942 and isotype mAbs were used at 1 µg/mL. IFN-γ levels were measured by ELISA. The isotype control antibodies (30 µg/mL) used were TPP-1238 (huIgG2 isotype control) and TPP-754 (huIgG1 isotype) control. The percentages indicate the fold differences in cytokine secretion. C. The effect of BAY 1834942 on IL-2 secretion in 100,000 CEACAM1 knockout Jurkat E6.1 or wild-type Jurkat E6.1 cells (both CD3-preactivated) after a 20-hour co-culture with 50,000 HCC2935 lung cancer cells in the presence of T cell engaging antibody construct EpCAM/CD3 (10 ng/mL) and either BAY 1834942 (40 µg/mL in X–vivo 20 medium) or TPP-1238 isotype control antibody. IL-2 levels in supernatants were analyzed by ELISA. The percentages indicate the fold differences in cytokine secretion. D. Recombinant CEACAM6 and CEACAM1 loaded on beads suppressed T cell signaling as determined from phosphorylated zeta-chain-associated protein kinase 70 (pZAP70, Tyr319) levels in CD3-activated Jurkat T cell lysates by immunoprecipitation and Western blot. HuIgG1 mAb Eureka was used as the Fc-isotype control. E. CEACAM6-suppressed cytokine secretion was reconstituted by BAY 1834942 in survivin T cells (100,000 cells) co-incubated for 20 h with 1 × 10⁶ CEACAM6-loaded beads as determined by IFN-γ levels measured with ELISA. The CD3/CEACAM6 beads were pre-incubated with BAY 1834942 or an isotype control antibody at room temperature for 20 min. The colored closed circles denote reactions as follows: Black circles: beads coated with huIgG1; Yellow circles: beads coated with anti-CD3 and huIgG1; Orange circles: beads coated with anti-CD3, huIgG1, and CEACAM6-Fc; Green circles: beads coated with anti-CD3, huIgG1, and CEACAM6-Fc + increasing concentrations of isotype control TPP-1238 in solution; Blue circles: beads coated with anti-CD3, huIgG1, and CEACAM6-Fc + increasing concentrations of BAY 1834942 in solution. F. Reversal of CEACAM6-induced suppression of cytokine secretion as described in (e) using an anti-CEACAM1 (TPP-9145) antibody and an isotype control. The colored closed circles denote reactions as follows: Black circles: beads coated with huIgG1; Yellow circles: beads coated with anti-CD3 and huIgG1; Orange circles: beads coated with anti-CD3, huIgG1, and CEACAM6-Fc; Green circles: beads coated with anti-CD3, huIgG1, and CEACAM6-Fc + increasing concentrations of isotype control TPP-754 in solution; Blue circles: beads coated with anti-CD3, huIgG1, and CEACAM6-Fc + increasing concentrations of the anti-CEACAM1 antibody (TPP-9145) in solution. The anti-CEACAM1 antibody was pre-incubated with Jurkat cells; Pink circles: beads coated with anti-CD3 and huIgG1 + anti-CEACAM1 antibody (TPP-9145) in solution; Dark purple circles: beads coated with huIgG1 + anti-CEACAM1 antibody (TPP-9145) in solution. Statistical analysis for (b-c) was performed using a linear model and corrected for family-wise error rate using Sidak’s method. ns, non-significant; *, p < .05; ***, p < .001.
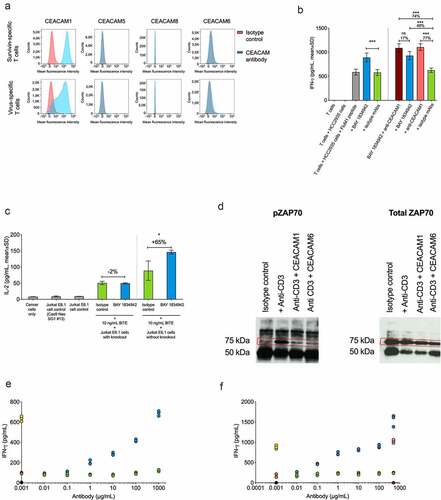
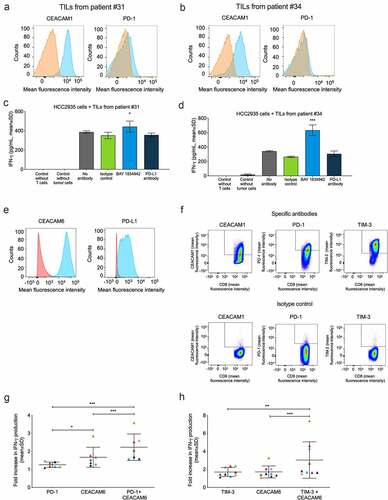
Figure 6. Effects of BAY 1834942 and anti-PD-1, anti-PD-L1 and anti-TIM-3 antibodies on IFN-γ cytokine secretion. Co-cultures of HCC-2935 lung cancer cells and tumor-infiltrating lymphocytes from pancreatic cancer patients were used in addition to combination experiments employing FluM1 virus-specific T cells. Antibodies were used at 30 µg/mL and EpCAM/CD3 bispecific antibody construct at 0.1 or 0.25 ng/mL as a T cell-engaging molecule. A.-B. Expression of CEACAM1 and PD-1 in TILs from (a) patient #31 and (b) patient #34 as determined by flow cytometry after gating on CD3-positive cells. The specific staining signals for anti-CEACAM1 (TPP-3006) and anti-PD1 are shown in blue and for the isotype controls in orange. C.-D. IFN-γ secretion (ELISA) from co-culture of 10,000 HCC2935 lung cancer cells and 20,000 TILs from (c) patient #31 and (d) patient #34. Statistical analysis was performed in comparison to the isotype control group using a linear model and corrected for familywise or false positive error rates using Dunnett’s or Sidak’s method. *, p < .01; ***, p < .001. E. Flow cytometry analysis of CEACAM6 and PD-L1 expression in HCC2935 lung cancer cells. The specific signals for BAY 1834942 and anti-PD-L1 are shown in blue and for the isotype control in red. F. Flow cytometry analysis of virus-specific T cells. Cells were gated on CD3 and CD8 and analyzed for CEACAM1 (TPP-3006), PD-1, and TIM-3 expression on day 14 after peptide induction. G.-H. Effects of BAY 1834942 on T cell activation in co-culture of CEACAM6-positive and PD-L1-positive FluM1-loaded HCC2935 lung cancer cells (10,000 cells) and virus-specific T cells (20,000 cells) in combination with inhibitory antibodies against checkpoint molecules (g) PD-1 (30 µg/mL), and (h) TIM-3 (50 µg/mL). For combination, BAY 1834942 was used at 1 µg/mL. Data represent mean percent increase in IFN-γ cytokine secretion (ELISA) by T cells as compared to respective isotype control antibodies. Each symbol represents an independent experiment with colors symbolizing the same co-cultures used. The median and SD are indicated with horizontal lines. Statistical analysis was performed using a linear model and corrected for family-wise error rate using Sidak’s method. *, p < .05; **, p < .01; ***, p < .001.