Figures & data
Table 1. Young Children: Most Prominent IPD-Causing NVT in Countries that have Introduced PCV13-CRM into their Infant Immunization Program
Table 2. Young Children: Most Prominent Non-Vaccine Types (NVT) Causing IPD in Countries that Introduced PHiD-CV-10 into the Infant Immunization Program
Table 3. Older Children and Adults: Most Prominent Non-Vaccine Types (NVT) Causing IPD in Countries that Introduced PCV13-CRM into the Infant Immunization Program
Table 4. Older Children and Adults: Most Prominent Non-Vaccine Types (NVT) Causing IPD in Countries that Introduced PHiD-CV-10 into the Infant Immunization Program
Figure 1. Most prominent NVT causing IPD in young children or older adults in countries that have introduced higher-valent PCVs. Y-axis: % each serotype represented of all NVT in that study. Upper panel (young children) includes the 18 data sets from combined Tables 1 and 2 comprising age ranges <2 years, 3-38 months, or <5 years. Lower panel (older adults) includes the 10 data sets from combined Tables 3 and 4 comprising age ranges >60 years or >65 years. Within each serotype grouping, the bars from left to right are in the same order as the studies in the combined tables, i.e., the left-most bar values represents the study with the highest proportion of NVT/all types, and the right-most the lowest. To accommodate as much information from the table as possible, for graphical purposes several serotyping assumptions were made. Panel A: IsraelCitation66: 15B/C=>15B; USCitation87: 10=>10A; 11=> 11A; 12=>12F; TaiwanCitation88:15 non-B=>15A. Panel B: SpainCitation89: 23A/B=> 23A; NZCitation21: 16=>16F; SwitzerlandCitation90: 22=>22F; 9 non 9V=> 9N; 15=>15A; TaiwanCitation88: 15 non-B=>15A. For graphical reasons, the Taiwan young children 15A and older children/adults serotype 3 values are only depicted up to 40%, and it was assumed that the number of 10A isolates from Belgium,Citation91 listed as >6, was 6. Note that a missing bar doesn't necessarily mean zero, just <5% of NVT isolates. NVT was defined as all serotypes except 1,4,5,6A,6B,7F,9V,14,18C,19A,19F,23F.
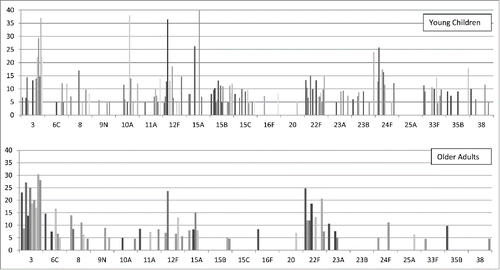
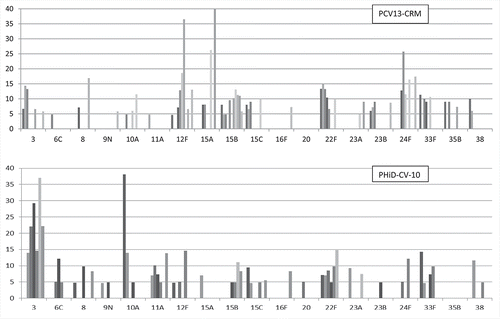
Figure 2. Most prominent NVT causing IPD in young children in countries that have introduced PCV13-CRM or PHiD-CV-10. Y axis: % each serotype represented of all NVT in that study. Upper panel (PCV13-CRM) includes the 11 data sets from Table 1, and lower panel (PHiD-CV-10) includes the 7 data sets from Table 2, which comprise age ranges <2 years, 3–38 months, or <5 years, and which used only PCV13-CRM or PHiD-CV-10. Values for each serotype represent % of all NVT IPD in each data set. Same bar ordering and serotype assumptions were made as in legend to .