
Figures & data
Table 1. The sequences used in this study
Table 2. Correlation of DHRS4-AS1 expression with clinicopathological characteristics in HCC patients
Figure 1. LncRNA DHRS4-AS1 was in low expression in HCC tissues and cell lines. (a) DHRS4-AS1 was predicted in descent expression level in HCC via TCGA database. (b) QRT-PCR exhibited significant reduction of DHRS4-AS1 expression in HCC tissues. (c) The level of DHRS4-AS1 in HCC cell lines. (d) The overall survival rate of HCC patients with different expression level of DHRS4-AS1. N = 3, *p < 0.05, **p < 0.01
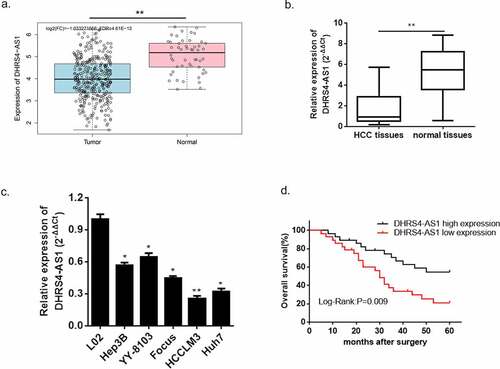
Figure 2. Overexpression of DHRS4-AS1 restricted HCC cell growth in vitro. (a) The expression level of DHRS4-AS1 determined by qRT-PCR. (b) Cell proliferation of HCC with DHRS4-AS1 overexpression that estimated by CCK-8. (c) The result of BrdU assay. (d) Colony-forming assay demonstrated decreased cell proliferation in DHRS4-AS1 up-regulated HCC cells. (e-f) Flow cytometry showed that overexpression of DHRS4-AS1 resulted in potentiated cell apoptosis, and cell cycle was captured at G0/G1 phase. (g) The expression level and quantitative analysis of apoptosis related proteins and cell cycle related protein detected via western blot. N = 3, *p < 0.05
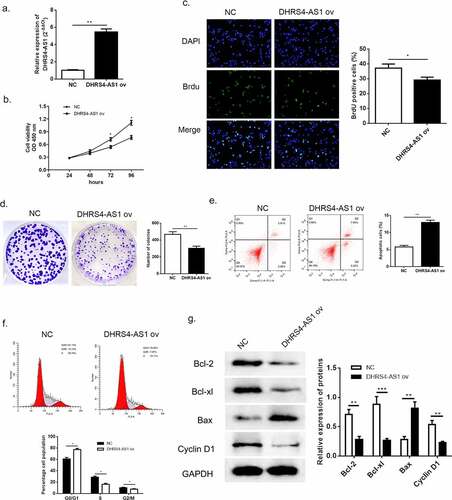
Figure 3. Knockdown of DHRS4-AS1 accelerated HCC cell growth in vitro. (a) The expression level of DHRS4-AS1 determined by qRT-PCR. (b) Cell growth of HCC with DHRS4-AS1 down-regulation that determined through CCK-8. (c) The result of BrdU assay. (d) Colony-forming assay demonstrated enhanced cell proliferation in DHRS4-AS1 down-regulated HCC cells. (e-f) Flow cytometry showed that silencing of DHRS4-AS1 resulted in alleviated cell apoptosis, and cell cycle that captured at G0/G1 phase dropped. (g) The expression level and quantitative analysis of apoptosis and cell cycle related protein detected via western blot. N = 3, *p < 0.05
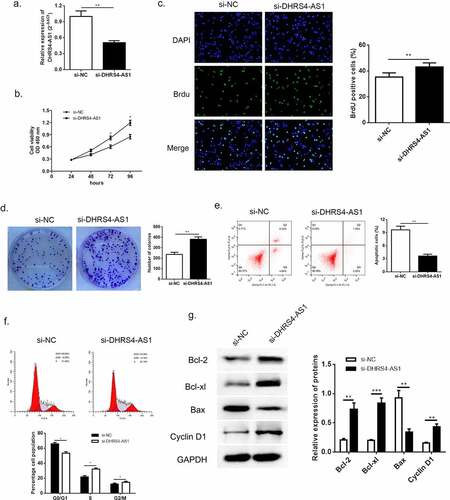
Figure 4. The tumor suppressed effect of DHRS4-AS1 in vivo. (a-b) Tumor size of HCC after 21-day of treatment. (c-d) The average tumor volume of HCC during 21-day of treatment. (e-f) The average tumor weight of HCC during 21-day of treatment. N = 4, ***p < 0.001
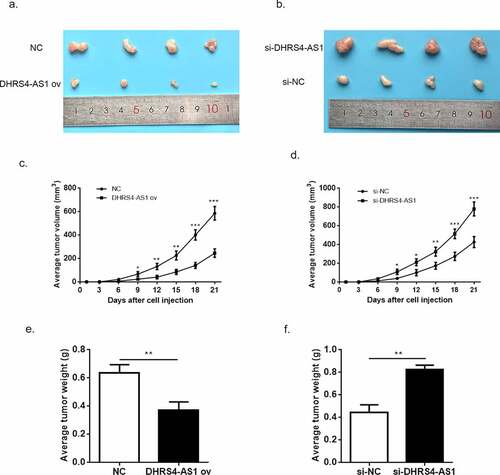
Table 3. Correlation of miR-522-3p level with clinicopathological characteristics in HCC patients
Figure 5. miR-522-3p was identified as a target gene of DHRS4-AS1. (a) The bioinformatics prediction biding site. (b) The result of dual-luciferase assay. (c) miR-522-3p was overexpressed in HCC tissues. (d) QRT-PCR detected significant high expression of miR-522-3p in HCC cell lines. N = 3, *p < 0.05, **p < 0.01
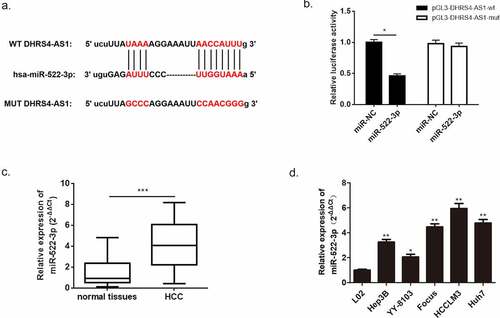
Figure 6. miR-522-3p reversed the inhibitory effects brought by DHRS4-AS1. (a) QRT-PCR determined the expression level of miR-522-3p. (b) CCK-8 assay showed that miR-522-3p promoted cell proliferation in DHRS4-AS1 and miR-522-3p mimics co-treated group versus solo DHRS4-AS1 ov treated group. (c) The result of BrdU assay. (d) Colony-forming experiment showed that miR-522-3p reversed the cell suppressed effect brought by DHRS4-AS1. (e-f) Cell apoptosis rate and cell cycle examined by flow cytometry. (g) The level and quantitative analysis of apoptosis related proteins’ and cell cycle related protein’s abundance detected via western blot. N = 3, *p < 0.05, **p < 0.01
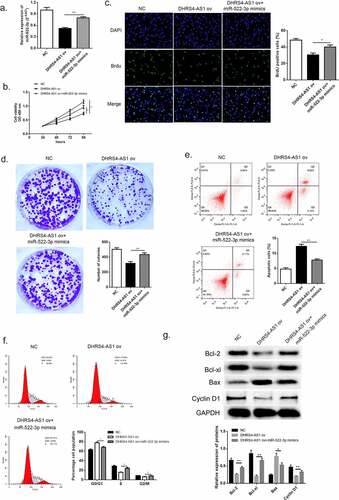
Figure 7. SOCS5 was identified as a target gene of miR-522-3p. (a) The bioinformatics prediction performed biding site. (b) The result of dual-luciferase assay. (c) Western blot and quantitative analysis showed that SOCS5 was down-regulated in HCC tissues. (d) QRT-PCR detected significant low expression of SOCS5 in HCC cell lines. N = 3, *p < 0.05, **p < 0.01
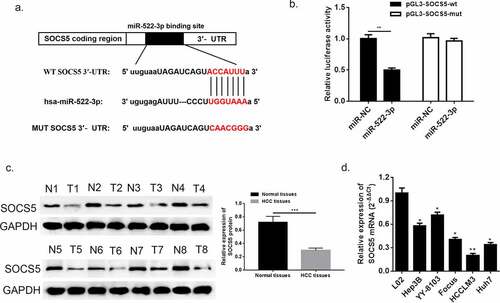
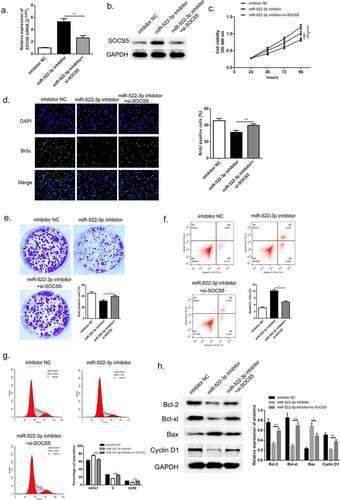
Figure 8. SOCS5 reversed the effects brought by miR-522-3p. (a) QRT-PCR and (b) western blot determined the expression level of SOCS5. (c) CCK-8 assay showed that SOCS5 alleviated cell growth in miR-522-3p inhibitor and si-SOCS5 co-treated group versus solo miR-522-3p inhibitor treated group. (d) The result of BrdU assay. (e) Colony-forming experiment showed that SOCS5 reversed the cell promoted effect brought by miR-522-3p. (f) Cell apoptosis rate and (g) cell cycle examined by flow cytometry. (h) The level and quantitative analysis of apoptosis related proteins’ cell cycle related protein’s abundance detected via western blot. N = 3, *p < 0.05, **p < 0.01
Data Availability Statement
Research data could be available from the corresponding author.