Figures & data
Figure 1. Effects of Tan IIA on Ang II–induced hypertrophy of H9c2 cells. (a) Molecular structure of Tan IIA. (b) MTT assay was performed to measure the inhibition rate of Tan IIA on the H9c2 cells. (c) Immunofluorescence staining of α-actin was performed to evaluate the surface area of H9c2 cells. (d, e) qPCR and Western blot were used to detect the expression of ANP, BNP, and β-MHC. ***P < 0.001 vs. control group, #P < 0.05 vs. Ang II group, ##P < 0.01 vs. Ang II group, ###P < 0.001 vs. Ang II group.
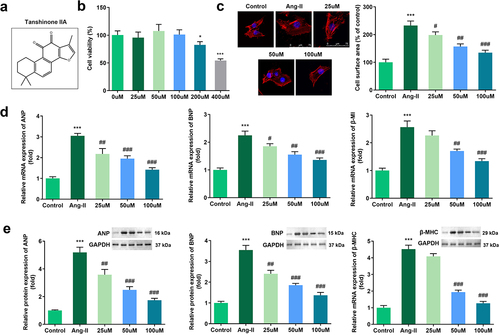
Figure 2. Effects of Tan IIA on cardiac hypertrophy in vivo. (a) HE staining was performed to evaluate the pathological changes of myocardial structure. (b–e) Echocardiography was used to evaluate the cardiac function. (f) HW/TL was calculated in each group. **P < 0.05 vs. control group, ***P < 0.001 vs. control group, #P < 0.05 vs. Ang II group, ##P < 0.01 vs. Ang II group, ###P < 0.001 vs. Ang II group.
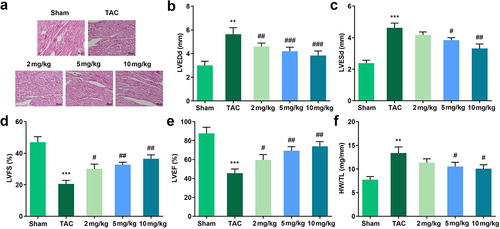
Figure 3. Effects of Tan IIA on the mRNA and protein expression of galectin-3 in H9c2 cells. qRT-PCR (a) and Western blot analysis (b) were performed to examine the expressions of galectin-3 in each group. ***P < 0.001 vs. control group, #P < 0.05 vs. Ang II group, ##P < 0.01 vs. Ang II group, ###P < 0.001 vs. Ang II group, &&P < 0.01 vs. Tan IIA group, &&&P < 0.001 vs. Tan IIA group.
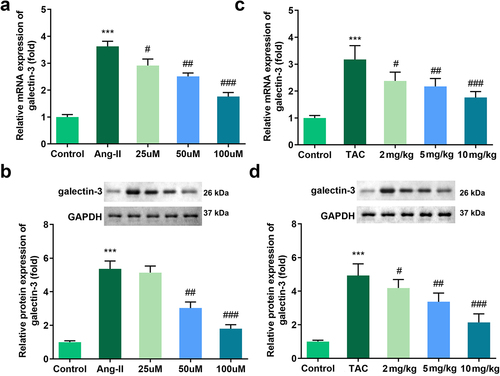
Figure 4. Galectin-3 overexpression reverses the effect of Tan IIA on cardiac hypertrophy. qPCR was used to detect the expression of galectin-3 in H9c2 cells. (b) Immunofluorescence staining of α-actin was performed to evaluate the surface area of H9c2 cells. (c, d) qPCR and Western blot were used to detect the expression of ANP, BNP, and β-MHC. **P < 0.01 vs. control group, ***P < 0.001 vs. control group, ##P < 0.01 vs. Ang II group, ###P < 0.001 vs. Ang II group, &&P < 0.01 vs. Ang II group, &&&P < 0.001 vs. Ang II group.
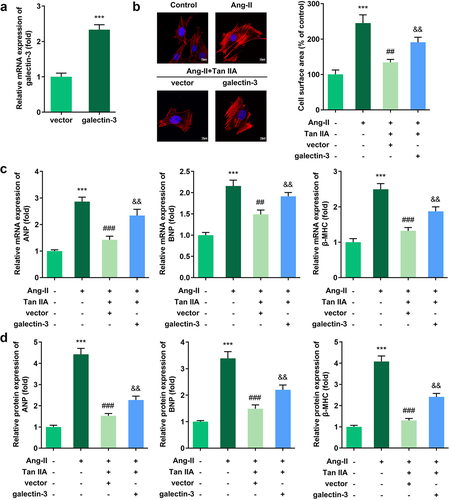
Figure 5. Tan IIA regulates ALKBH5-mediated m6A modification of galectin-3. The total m6A content of H9c2 cells was detected. (b) MeRIP assay was performed to detect the m6A modification of galectin-3. (c) qPCR was used to detect the expression of methylases and demethylases. (d, e) MeRIP assay was performed to detect the m6A modification of galectin-3. (e–h) qPCR and Western blot were used to the expression of galectin-3. (f) qPCR was performed to detect the stability of galectin-3 mRNA. ***P < 0.001 vs. control group, ##P < 0.01 vs. Ang II group, &P < 0.05 vs. Ang II group, &&P < 0.01 vs. Ang II group.
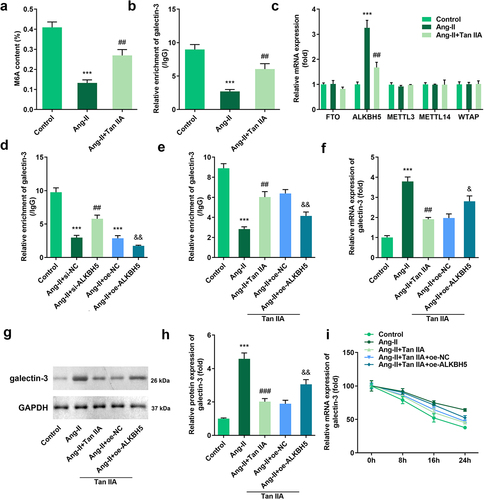
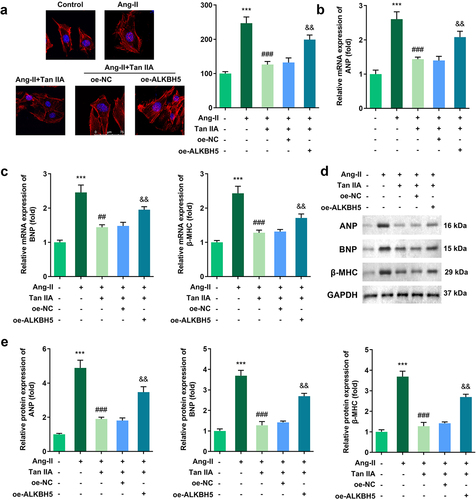
Figure 6. ALKBH5 reverses the effect of Tan IIA on cardiac hypertrophy. (a) Immunofluorescence staining of α-actin was performed to evaluate the surface area of H9c2 cells. (b–e) qPCR and Western blot were used to detect the expression of ANP, BNP, and β-MHC. ***P < 0.001 vs. control group, ##P < 0.01 vs. Ang II group, ###P < 0.001 vs. Ang II group, &&P < 0.01 vs. Ang II group.