
Figures & data
Figure 1. An overview of CQD properties and its applications in biomedicine.
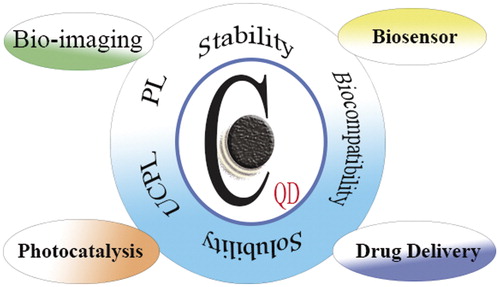
Table 1. The main advantages and disadvantages of various preparation methods of CQDs.
Figure 2. Processing diagram for electrochemical fabrication of CQDs.
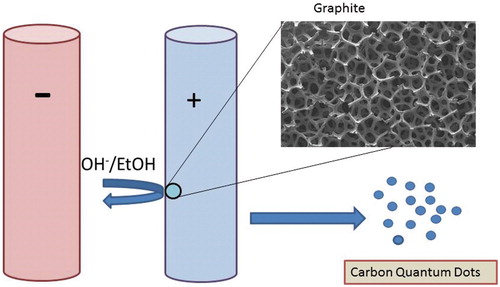
Figure 3. HR-TEM images of CQDs obtained from electrochemical methods. (Reprinted from Ref. [Citation31] Copyright 2016, with permission from Elsevier).
![Figure 3. HR-TEM images of CQDs obtained from electrochemical methods. (Reprinted from Ref. [Citation31] Copyright 2016, with permission from Elsevier).](/cms/asset/15345890-0a17-4495-a630-ed60f296b20f/ianb_a_1377725_f0003_b.jpg)
Figure 4. Processing diagram for the synthesis of multicolour photoluminescent carbon dots. (Reprinted from Ref. [Citation22] with permission from Copyright 2009 John Wiley and Sons).
![Figure 4. Processing diagram for the synthesis of multicolour photoluminescent carbon dots. (Reprinted from Ref. [Citation22] with permission from Copyright 2009 John Wiley and Sons).](/cms/asset/c07d5991-058c-4662-b24c-102aa9b9d869/ianb_a_1377725_f0004_c.jpg)
Figure 5. (a) TEM image of 5 nm-CQDS obtained from glucose; (b, c) photographs of CQDs dispersals in water with visible light and UV (365 nm, centre) illumination, respectively; (d–g) fluorescent microscope images of CQDs under diverse excitation: d, e, f and g for 360, 390, 470 and 540 nm, respectively. (Reprinted from Ref. [Citation11] Copyright 2011, with permission from Elsevier).
![Figure 5. (a) TEM image of 5 nm-CQDS obtained from glucose; (b, c) photographs of CQDs dispersals in water with visible light and UV (365 nm, centre) illumination, respectively; (d–g) fluorescent microscope images of CQDs under diverse excitation: d, e, f and g for 360, 390, 470 and 540 nm, respectively. (Reprinted from Ref. [Citation11] Copyright 2011, with permission from Elsevier).](/cms/asset/375bbd0d-ff2d-4251-9526-be01f3efbdbc/ianb_a_1377725_f0005_c.jpg)
Figure 6. (a) Schematic depiction of producing of CQDs by MAH technique. (Reprinted with permission from Ref. [Citation41] Copyright (2012) American Chemical Society); (b) processing diagram of the one-step preparation of luminescent CQDs in PEG200N solvent (Reprinted from Ref. [Citation46] with permission from The Royal Society of Chemistry); (c) schematic representation of laser ablation experimental setup. (Reprinted from Ref. [Citation45] with permission from The Royal Society of Chemistry).
![Figure 6. (a) Schematic depiction of producing of CQDs by MAH technique. (Reprinted with permission from Ref. [Citation41] Copyright (2012) American Chemical Society); (b) processing diagram of the one-step preparation of luminescent CQDs in PEG200N solvent (Reprinted from Ref. [Citation46] with permission from The Royal Society of Chemistry); (c) schematic representation of laser ablation experimental setup. (Reprinted from Ref. [Citation45] with permission from The Royal Society of Chemistry).](/cms/asset/1c8530f5-2eb4-4b85-9ad2-dbf7cfbac403/ianb_a_1377725_f0006_c.jpg)
Figure 7. Schematic illustration of limited reaction in nanoreactors for synthesis of CQDs. (Reprinted from Ref. [Citation37] with permission from The Royal Society of Chemistry).
![Figure 7. Schematic illustration of limited reaction in nanoreactors for synthesis of CQDs. (Reprinted from Ref. [Citation37] with permission from The Royal Society of Chemistry).](/cms/asset/422efdfc-e8d2-496b-a8eb-9030cf24e0bc/ianb_a_1377725_f0007_c.jpg)
Figure 8. (a) Diagram of the synthesis of CQDs unzipped from PAN@PMMA core–shell nanoparticles. Numerous n-CQDs were unzipped from one polymeric nanoparticle and exhibited diverse PL behaviours at different pyrolysis temperatures. (b, c) TEM images of the PAN@PMMA core–shell nanoparticles. Scale bars are 200 nm (b) and 50 nm (c), respectively. (d) DLS curve of the PAN@PMMA core–shell nanoparticles; the inset exhibits a photograph of a PAN@PMMA microemulsion. (Reprinted from Ref. [Citation49] with permission from The Royal Society of Chemistry).
![Figure 8. (a) Diagram of the synthesis of CQDs unzipped from PAN@PMMA core–shell nanoparticles. Numerous n-CQDs were unzipped from one polymeric nanoparticle and exhibited diverse PL behaviours at different pyrolysis temperatures. (b, c) TEM images of the PAN@PMMA core–shell nanoparticles. Scale bars are 200 nm (b) and 50 nm (c), respectively. (d) DLS curve of the PAN@PMMA core–shell nanoparticles; the inset exhibits a photograph of a PAN@PMMA microemulsion. (Reprinted from Ref. [Citation49] with permission from The Royal Society of Chemistry).](/cms/asset/5347682a-0e1f-48ad-b50a-dce4b50702ca/ianb_a_1377725_f0008_c.jpg)
Figure 9. Schematic illustration of producing soluble CQDs with adjustable sizes from single-chain polymeric nanoparticles. (Reprinted from Ref. [Citation51] with permission from The Royal Society of Chemistry).
![Figure 9. Schematic illustration of producing soluble CQDs with adjustable sizes from single-chain polymeric nanoparticles. (Reprinted from Ref. [Citation51] with permission from The Royal Society of Chemistry).](/cms/asset/60831eae-ad43-4837-922e-a7d7cfc9a2fd/ianb_a_1377725_f0009_c.jpg)
Figure 10. (a) Four typical sizes of CQDs illuminated by white (left; usual lamp; from left to right the colors are pale green, pale yellow, yellow and red, respectively) and UV light (right; 365 nm; from left to right the colors are blue, green, yellow and red, respectively); (b) four typical sizes of CQDs: from left to right the colors are red, black, green and blue lines are related to the PL spectra for blue-, green-, yellow- and red-emission CQDs, respectively; (c) correlation between PL properties and CQDs size; (d) the dependence of HOMO–LUMO gap on the size of the CQDs. (Reprinted from Ref. [Citation30] with permission from Copyright 2010 John Wiley and Sons).
![Figure 10. (a) Four typical sizes of CQDs illuminated by white (left; usual lamp; from left to right the colors are pale green, pale yellow, yellow and red, respectively) and UV light (right; 365 nm; from left to right the colors are blue, green, yellow and red, respectively); (b) four typical sizes of CQDs: from left to right the colors are red, black, green and blue lines are related to the PL spectra for blue-, green-, yellow- and red-emission CQDs, respectively; (c) correlation between PL properties and CQDs size; (d) the dependence of HOMO–LUMO gap on the size of the CQDs. (Reprinted from Ref. [Citation30] with permission from Copyright 2010 John Wiley and Sons).](/cms/asset/0c9d7111-8e8f-4acc-82a8-1486abba23fe/ianb_a_1377725_f0010_c.jpg)
Figure 11. (a) Schematic representation of the light-excited fluorescence modulation of spiropyran-modified CQDs. (Reprinted from Ref. [Citation60] with permission from The Royal Society of Chemistry.); (b) schematic diagram for the preparation of photoluminescent CDs, flexible CD film and CDs/silica particles. (Reprinted from Ref. [Citation52] with permission from Copyright 2011 John Wiley and Sons).
![Figure 11. (a) Schematic representation of the light-excited fluorescence modulation of spiropyran-modified CQDs. (Reprinted from Ref. [Citation60] with permission from The Royal Society of Chemistry.); (b) schematic diagram for the preparation of photoluminescent CDs, flexible CD film and CDs/silica particles. (Reprinted from Ref. [Citation52] with permission from Copyright 2011 John Wiley and Sons).](/cms/asset/ed5d3ce9-9884-4eb2-8a6e-45bca6cf309c/ianb_a_1377725_f0011_c.jpg)
Figure 12. (a) Diagram illustration of UV/Vis absorption and PL emission spectra (recorded for increasingly longer excitation wavelengths from 320 to 520 nm in 20 nm increments) of CQDs surface-passivated with PEG1500N in water. In the inset, the emission spectral intensities are normalized. (b) Optical photograph attained under excitation at 365 nm. (Reprinted with permission from Ref.[Citation22] Copyright 2009 John Wiley and Sons).
![Figure 12. (a) Diagram illustration of UV/Vis absorption and PL emission spectra (recorded for increasingly longer excitation wavelengths from 320 to 520 nm in 20 nm increments) of CQDs surface-passivated with PEG1500N in water. In the inset, the emission spectral intensities are normalized. (b) Optical photograph attained under excitation at 365 nm. (Reprinted with permission from Ref.[Citation22] Copyright 2009 John Wiley and Sons).](/cms/asset/c1102c40-5fcd-4726-9272-5a51bafd56b7/ianb_a_1377725_f0012_c.jpg)
Figure 13. PL spectra of CQDs exited by N-IR (a) CQDs obtained from glucose/NaOH; (b) CQDs obtained from glucose/HCl. (Reprinted from Ref. [Citation11] Copyright 2011, with permission from Elsevier).
![Figure 13. PL spectra of CQDs exited by N-IR (a) CQDs obtained from glucose/NaOH; (b) CQDs obtained from glucose/HCl. (Reprinted from Ref. [Citation11] Copyright 2011, with permission from Elsevier).](/cms/asset/b86e102f-6447-4415-b060-0bfd85926947/ianb_a_1377725_f0013_c.jpg)
Figure 14. Luminescence images (all scale bars 20 nm) of the CQDs with (a) argon ion laser excitation at 458 nm and (b) femtosecond pulsed laser excitation at 800 nm; (c) is an overlap of (a) and (b). (Reprinted with permission from Ref. [Citation14] Copyright (2007) American Chemical Society).
![Figure 14. Luminescence images (all scale bars 20 nm) of the CQDs with (a) argon ion laser excitation at 458 nm and (b) femtosecond pulsed laser excitation at 800 nm; (c) is an overlap of (a) and (b). (Reprinted with permission from Ref. [Citation14] Copyright (2007) American Chemical Society).](/cms/asset/109b22fc-6f4e-4adb-8dbd-de84d0f8751d/ianb_a_1377725_f0014_c.jpg)
Figure 15. Intravenous injection of C-Dots: (a) bright field, (b) as-detected fluorescence (Bl, bladder; Ur, urine) and (c) colour-coded images. The same order is used for the images of the dissected kidneys (a′–c′) and liver (a″–c″). (Reprinted with permission from Ref. [Citation42] Copyright (2009) American Chemical Society).
![Figure 15. Intravenous injection of C-Dots: (a) bright field, (b) as-detected fluorescence (Bl, bladder; Ur, urine) and (c) colour-coded images. The same order is used for the images of the dissected kidneys (a′–c′) and liver (a″–c″). (Reprinted with permission from Ref. [Citation42] Copyright (2009) American Chemical Society).](/cms/asset/5cc7bf26-c47e-48ce-8dab-2d8a1e843e85/ianb_a_1377725_f0015_c.jpg)
Figure 16. (a, b) SEM image of photocatalysts for SiO2/CQDs and TiO2 CQDs; insets exhibit the corresponding HRTEM images; (c) correlation between MB concentration and reaction time for diverse catalysts: SiO2/CQDs, TiO2/CQDs, SiO2 NPs, TiO2 NPs and CQDs. (Reprinted with permission from Ref. [Citation30] Copyright 2010 John Wiley and Sons).
![Figure 16. (a, b) SEM image of photocatalysts for SiO2/CQDs and TiO2 CQDs; insets exhibit the corresponding HRTEM images; (c) correlation between MB concentration and reaction time for diverse catalysts: SiO2/CQDs, TiO2/CQDs, SiO2 NPs, TiO2 NPs and CQDs. (Reprinted with permission from Ref. [Citation30] Copyright 2010 John Wiley and Sons).](/cms/asset/1ba6d6de-34bd-4d99-be5d-cfd709814635/ianb_a_1377725_f0016_b.jpg)
Figure 17. Illustration of catalytic mechanism for TiO2/CQDs under visible daylight lamp. (Reprinted with permission from Ref. [Citation30] Copyright 2010 John Wiley and Sons).
![Figure 17. Illustration of catalytic mechanism for TiO2/CQDs under visible daylight lamp. (Reprinted with permission from Ref. [Citation30] Copyright 2010 John Wiley and Sons).](/cms/asset/15856214-bd21-4a3c-8be4-056822100036/ianb_a_1377725_f0017_b.jpg)
Figure 18. Graphical depiction of FRET-based ratiometric sensing of mitochondrial H2O2 in living cell by the nano-probe. (Reprinted with permission from Ref. [Citation83] Copyright 2013 John Wiley and Sons).
![Figure 18. Graphical depiction of FRET-based ratiometric sensing of mitochondrial H2O2 in living cell by the nano-probe. (Reprinted with permission from Ref. [Citation83] Copyright 2013 John Wiley and Sons).](/cms/asset/92cb578d-c3b3-4d6c-9f91-4bad0b1477c9/ianb_a_1377725_f0018_c.jpg)
Figure 19. (a) Preparation procedure for CQDs-Oxa and its applications in bioimaging and theranostics. (Reprinted with permission from Ref. [Citation92] Copyright 2014 John Wiley and Sons.); (b) graphical depiction of the preparation of luminescent HCQDs and the loading of DOX. (Reprinted from Ref. [Citation16] Copyright 2013, with permission from Elsevier).
![Figure 19. (a) Preparation procedure for CQDs-Oxa and its applications in bioimaging and theranostics. (Reprinted with permission from Ref. [Citation92] Copyright 2014 John Wiley and Sons.); (b) graphical depiction of the preparation of luminescent HCQDs and the loading of DOX. (Reprinted from Ref. [Citation16] Copyright 2013, with permission from Elsevier).](/cms/asset/66d69d86-d8a6-48e7-aacf-a68e0b21e98d/ianb_a_1377725_f0019_c.jpg)