Figures & data
Figure 1. Design and construction of the K562 human cell-based vaccine. (A) Schematic depiction of the construction of K562-S vaccine, a whole human cell-based vaccine expressing the full-length spike (S) protein of SARS-CoV-2 as antigen. Verification of universal expression of S-protein and its membrane presentation of the selected K562-S clones by immunofluorescence analysis (B), western blotting (C) and flow cytometry (D). For (B), cells were fixed and immunostained for S-protein (Green) following procedures described under “Materials and methods”. For (C), the lysates derived from 1 × 10⁶ K562-S cells, together with the indicated amounts of purified extra cellular domain of spike protein (ECD) S-protein, were subjected to denaturing gel electrophoresis, followed by immunoblotting with a rabbit anti-S antibody. For (D), K562-S cells and original K562 (K562-WT) cells were stained with PE-labelled purified human ACE2 protein, followed by flow cytometry.
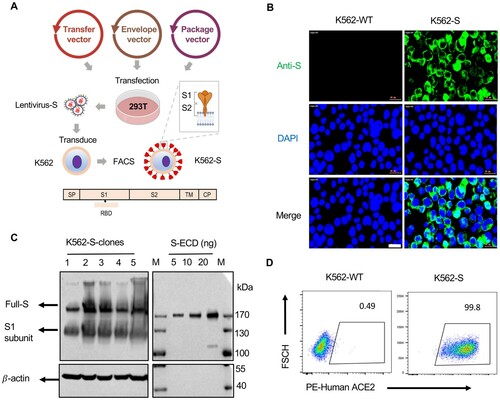
Figure 2. The effect of inactivation on the immunogenicity of K562-S vaccines. (A) Experimental scheme. Female C57/BL/6 (n = 6/group) mice were immunized at week 0 with either empty DNA vector (DNA-psv) or S-expressing DNA vector (DNA-psv-S), followed by booster immunization at week 4 with DNA-psv-S, parental K562 cells (K562-WT), or K562-S cells that were untreated (K562-S) or through inactivation by formalin (K562-S-FI) or X-ray irradiation (K562-S-X-ray). The dosages of DNA vectors and K562-S were 100 μg and 1 × 10⁶ cells, respectively. (B and C) Serum antibody responses were assessed at week 6 post prime by a RBD-specific binding antibody ELISA (B) and pseudovirus neutralization assays (C). (D and E) Assessment of Th1 or Th2 bias in the immune response. The serum levels of IgG2c and IgG1 antibody were determined at week 6 post prime by ELISA (D) to calculate the IgG2c/IgG1 ratio (E), which is a reliable surrogate measure of Th1/Th2 status. Antibody titer data were presented as geometric mean titers (GMT) ± geometric standard deviation (GSD). Kruskal–Wallis test with Dunn’s adjustment were applied when comparing groups. ns = no significant.
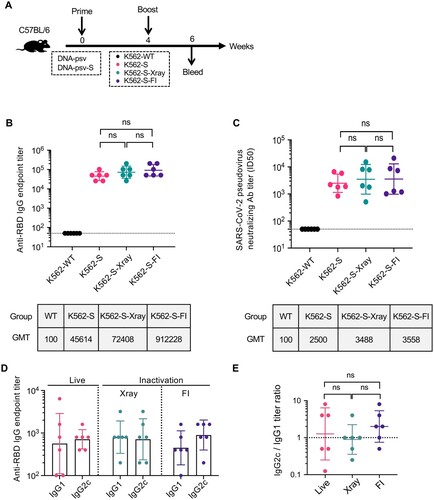
Figure 3. Identification of optimal adjuvant for K562-S vaccine in induction of humoral immunity against SARS-CoV-2. (A) Experimental schedule. Female C57/BL/6 (n = 6/group) mice were subjected to a homologous prime-boost regimen with 4-week interval consisting of K562-S-FI either non-adjuvanted or adjuvanted with Alum, MnJ, CpG, Alum plus CpG, or MnJ plus CpG. (B and C) Serum antibody responses were assessed at week 6 post prime by RBD-specific binding antibody ELISA (B) and pseudovirus neutralization assays (C). (D and E) Serum levels of SARS-CoV-2 RBD-specific IgG1 and IgG2c antibodies as determined by an ELISA (D) and the derived IgG2c/IgG1 ratios (E). Antibody titer data were presented as geometric mean titers (GMT) ± geometric standard deviation (GSD). Kruskal–Wallis test with Dunn’s adjustment were applied when comparing groups. * p < 0.05, ** p < 0.01, *** p < 0.001; **** p < 0.0001, ns = non-significant.
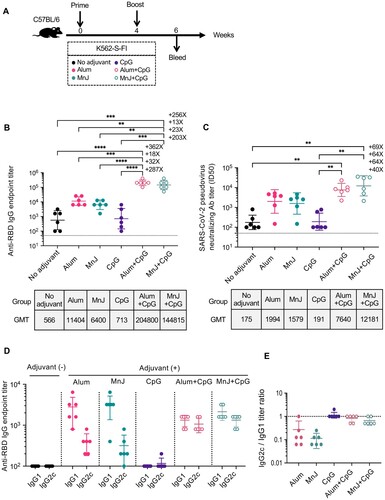
Figure 4. Immunogenicity of K562-S vaccines and afforded protection against the SARS-CoV-2 in hACE2 mice. (A) Experimental schedule. Transgenic hACE2-C57/BL/6 mice (n = 6/group) were vaccinated intramuscularly (IM) with 1 × 10⁶ cells of alum adjuvanted parental K562 (sham) or indicated adjuvanted K562-S at week 0 (prime) and 3 (boost), followed by intranasal administration of 1 × 10⁴ PFU of SARS-CoV-2 (CHN/Shanghai_CH-02/2020) at week 5. (B and C) Serum antibody responses were assessed at week 4 post prime by RBD-specific binding antibody ELISA (B) and pseudovirus neutralization assays (C). (D) Viral RNA copies in the lungs on day 3 post infection. RNA was extracted from lung homogenates; the contained viral N transcripts were determined by qRT-PCR and plotted as log10 copies per gram (tissue weight). (E) Representative images of H&E-stained lung sections from sham and vaccination mice on day 3 after SARS-CoV-2 infection. Lung histology data were used to calculate quantified pathological scores. Scale bar, 200 μm. Results are expressed as mean ± SD. (F) Kaplan-Meier survival curves of challenged mice were compared by using log-rank test and (G) the body weight changes were plotted for each group. Data are means ± SD.. Comparison among groups were conducted by Kruskal–Wallis test with Dunn’s adjustment. *p < 0.05; **p < 0.01; ***p < 0.001; ****p < 0.0001; ns, no significant.
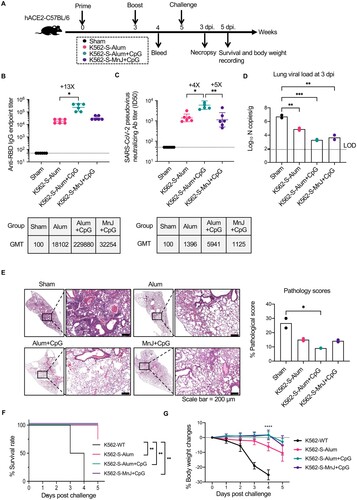
Figure 5. Strength and durability of antibody response to K562-S vaccination in a different mouse strain. (A) Schedule of vaccination and specimen collection. Female ICR (n = 9/group) mice were subjected to a homologous prime-boost regimen with 4-week interval consisting of either alum adjuvanted K562-S-FI or MnJ plus CpG adjuvanted K562-S-FI. Sera were collected between week 5 and 24 post prime for antibody assessment. (B and C) Time-course changes in RBD-specific binding antibody titers as determined by ELISA (B) and neutralizing antibody titers as assessed against pseudovirus (C). The tops of the bars represent the geometric mean titers (GMTs). Significance of difference between means was assessed by nonparametric Mann–Whitney test. *p < 0.05; **p < 0.01; ***p < 0.001; ****p < 0.0001; ns, no significant.
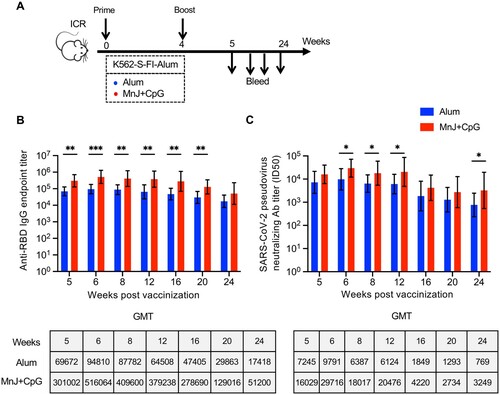
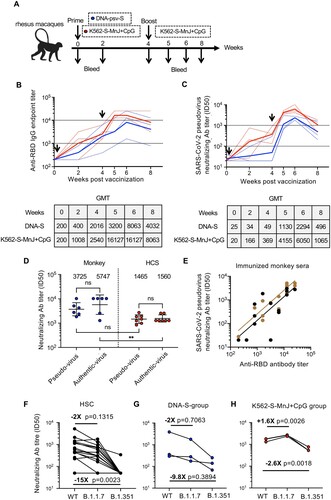
Figure 6. Immunogenicity of K562-S vaccines in non-human primates. (A) Schedule of vaccination and specimen collection. Rhesus macaques were primed with 1 mg of DNA-S or 1 × 10⁷ MnJ plus CpG adjuvanted K562-S-FI cells at week 0, and boosted with 1 × 10⁷ MnJ plus CpG adjuvanted K562-S-FI cells at week 4. Sera were collected at week 0, 2, 4, 5, 6, and 8. (B and C) Time-course changes in RBD-specific binding antibody titers as determined by ELISA (B) and neutralizing antibody titers as assessed against pseudovirus (C). The dotted lines represented data collected from individual animals, coloured differently according to the prime: DNA-S, blue; adjuvanted K562-S, red. The solid line showed the trend of GMTs. (D) Comparison of neutralizing antibody titers, as determined by both pseudovirus and authentic SARS-CoV-2 neutralization assays, between vaccinated monkey sera and human convalescent sera (HCS). The assayed monkey sera were collected at week 6 post prime from all six vaccinated animals. The GMT values were shown on top of the plot. Significance of difference between means was assessed by nonparametric Mann–Whitney test. **p < 0.01; (E) Correlation analysis between RBD-specific binding antibody titers and pseudovirus neutralizing antibody titers. Trends lines were separately created for DNA-S prime group (black) and K562-S prime group (brown) and the data were used for calculation of Spearman correlation coefficients, which were indicated adjacent to the lines. (F–H) Neutralization titers against SARS-CoV-2 versus its variants B.1.1.7 and B.1.351 in human convalescent sera (HCS) (F), sera from DNA-S group (G), and sera from K562-S-MnJ + CpG group (H). The pairwise mean-fold changes in titers were indicated. Significance of difference was assessed by Kruskal–Wallis test with Dunn’s adjustment.