Figures & data
Table 1. Specific primer sequences.
Figure 1. Effect of co-administration of quercetin with AlCl3 on the working memory, in AlCl3 induced AD rats (A: spontaneous alternation rate (%), B: frequency of the same arm returns). Data are displayed as mean± SEM (n = 6). * P < 0.05.
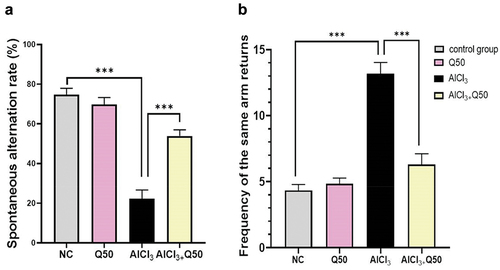
Figure 2. Effect of co-administration of quercetin with AlCl3 on the body weight. Data are displayed as mean± SEM (n = 6). * P < 0.05.
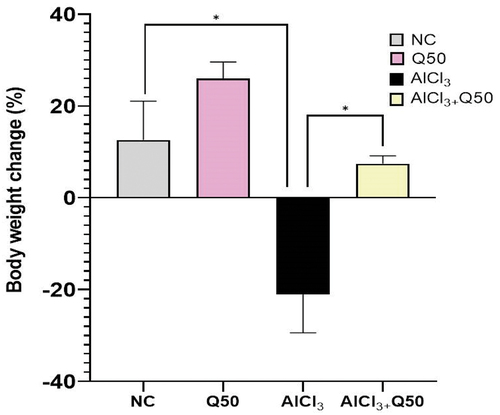
Figure 3. The effect of co-administration of Q on APP and BACE1 gene expression in AD rat hippocampus tissue. A: Fold change of. APP, B: Fold change of BACE1. Data are displayed as mean± SEM (n = 8). * P < 0.05.
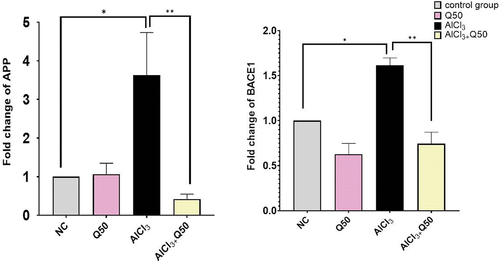
Figure 4. The effect of co-administration of Q on gamma secretases genes expression in AD rat hippocampus tissue. A: Fold change of APH1, B: Fold change of PSEN1. Data are displayed as mean ± S.E.M (n = 8). * P < 0.05.
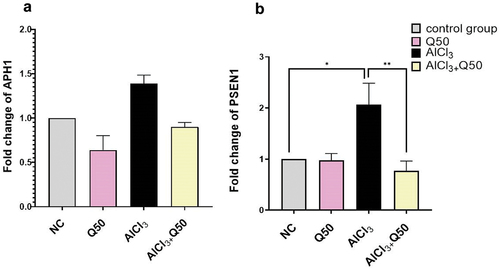
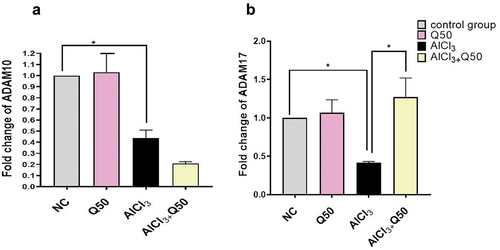
Figure 5. The effect of co-administration of Q on alpha secretase gene expression in AD rat hippocampus tissue. A: Fold change of Adam 10, B: fold change of Adam 17. Data are displayed as mean± SEM (n = 8). * P < 0.05.