Figures & data
Table 1. Classification of political groups in the European Parliament.
Figure 1. Number of tweets per week over the period.
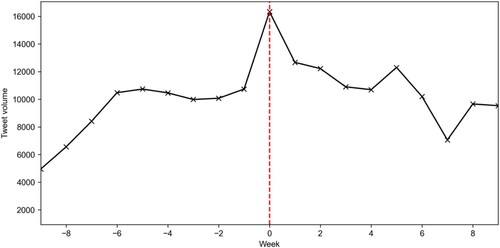
Figure 2. Graph showing the distribution of the 50 most used hashtags each week, with their size proportional to their relative frequency of use. Hashtags pertaining to the war are shown with grey background and white text. The vertical red dotted line signifies the beginning of Russia’s invasion of Ukraine.
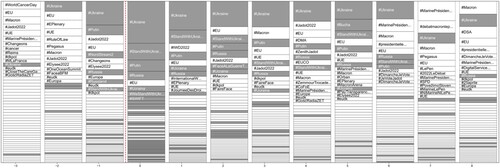
Figure 3. (a) These graphs show the proportion of hashtags that pertain to Ukraine over time, per political group and geographical division respectively. This includes all hashtags that have been classified as referring to the war. (b) The second graph compares the East and West European countries.
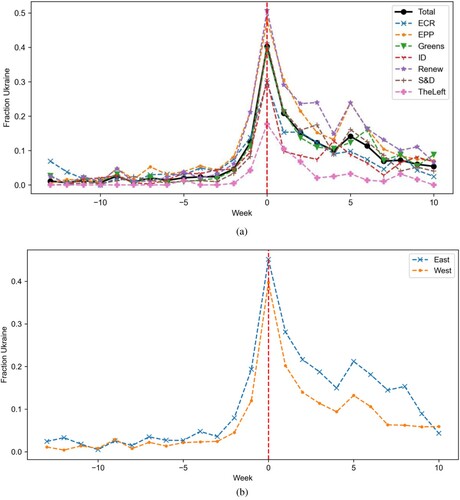
Figure 4. Retweet network before the war. Retweet structure of the parliamentary network. (a) The left figure shows the parliamentarians by whether they represent East or West Europe, while the right network shows the parliamentarians’ political group. (b) The network reveals the fractures and divisions of the union, in particular how the Eurosceptic political groups are split from the larger union. Geographically, Europe is relatively more integrated, except for a group of ECR’s parliamentarians (lower right) who are strongly split from the larger network.
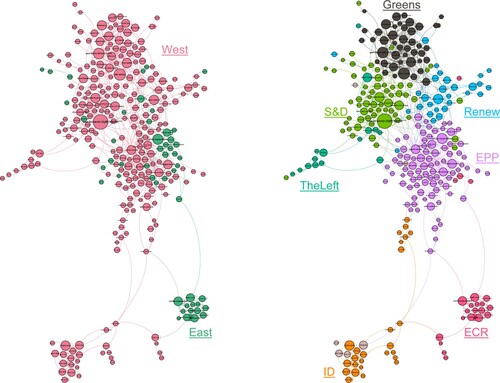
Figure 5. (a, b) Endorsement networks after the war. This graph shows the retweet structure of the parliamentary network after the war. As can be seen, the network is not visibly more cohesive than before the war. The political groups that were outside of the main cluster remain so following the war.
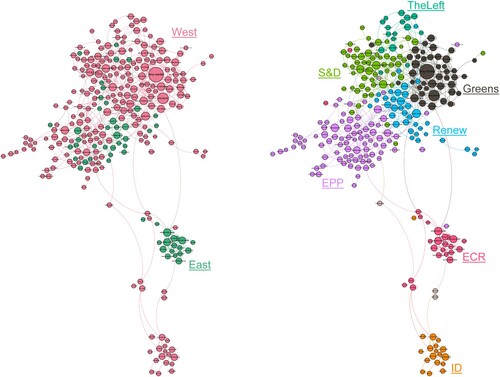
Figure 6. E–I index, before and after. The figure shows that the network is fragmented among Europhile and Euroskeptic political groups. Particularly noteworthy is the increased isolation of Euroskeptic political groups following the war, with a 95% confidence level.
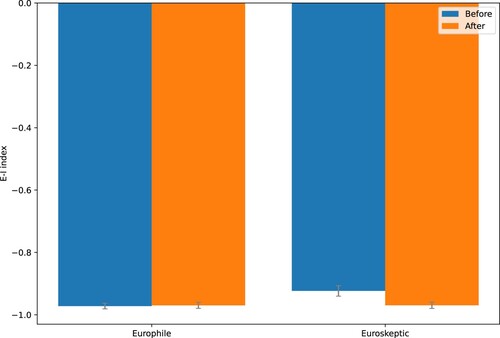
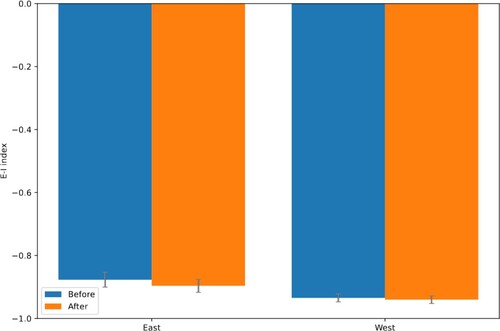
Figure 7. E–I index, before and after the war. As observed, the network is fragmented across Eastern and Western Europe. The effects of the war are statistically non-significant at a 95% confidence level.