Figures & data
Figure 1 STIR sectional image of both thighs in the middle third. Asterisk marks muscle area with increased uptake.
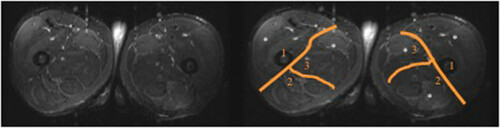
Table 1 Subjects’ baseline characteristics
Figure 2 MRI evidence of muscular injury. Percent of subjects with MRI evidence of muscular injury. ART, anterior right thigh; PRT, posterior right thigh; MRT, medial right thigh; ALT, anterior left thigh; PLT, posterior left thigh; MLT, medial left thigh. *p < 0.05 for curcumin vs placebo.
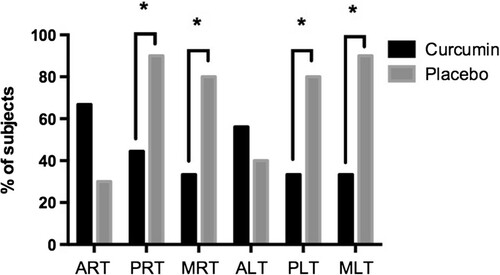
Figure 3 Pain intensity. Patient-reported pain intensity in the right thigh (RT), left thigh (LT), right leg (RL), left leg (LL) and total pain score (the sum of the scores of each lower limb).
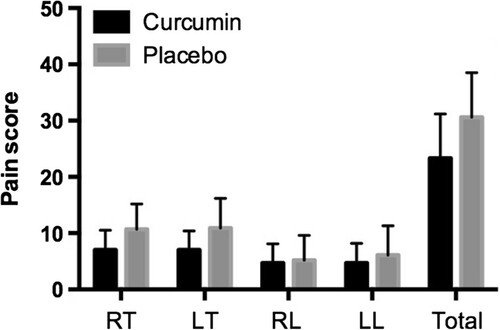
Figure 4 Markers of muscle damage and inflammation. A. Creatine kinase (CK), B. high-sensitivity CRP (hsCRP), C. interleukin-8 (IL-8) and D. monocyte chemoattractant protein-1 (MCP-1) levels measured at baseline and 2 and 24 hours after the downhill running test. *p < 0.05.
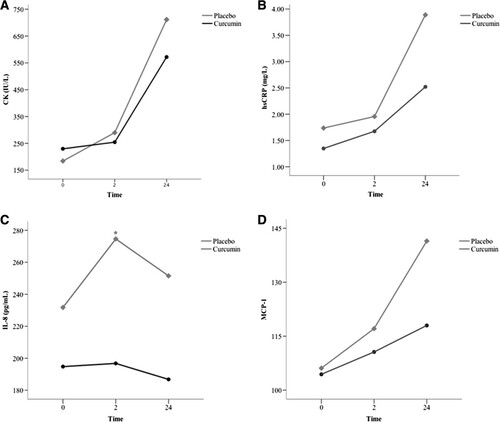
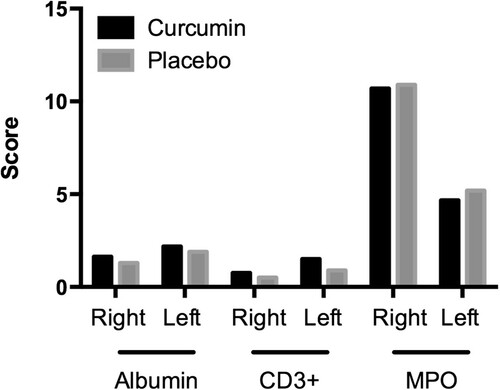
Figure 5 Sarcolemmal damage and acute inflammatory response to exercise. CD3+, CD positive cells; MPO, myeloperoxidase.