Figures & data
Figure 1. Tα1 promotes Aire and Indo1 gene expression on murine ECs. ECs were exposed to Candida albicans and assessed for Aire (A and D), Indo1 (B and E) and Il10 (C and F) gene expression in the presence of Tα1 (A – C) or siPtma (prothymosin alpha) (D – F). ECs were purified from murine intestine as described Citation[40] and stimulated (106) with inactivated Candida yeasts (1:1 ratio), with and without 100 μg/ml of Tα1 (SciClone Pharmaceuticals, Inc) for 12 h at 37°C. ECs were exposed to 1 µM siPtma (Dharmacon RNAi Technologies) for 72 h, as described Citation[42] before the addition of Candida. Gene expression was evaluated by real-time RT-PCR (Stratagene) with specific primers Citation[42]. The Aire primers were as follows: Forward, 5′-CCTGGATTTCTGGAGGATTCTCT-3′; reverse, 5′-CCGTCCAGGATGCTATGCA-3′. *p < 0.05, ‡p < 0.01, §p < 0.001, Tα1-treated versus untreated cells and Aire0/0 versus Aire+/+ cells. The data are pooled from two experiments.
![Figure 1. Tα1 promotes Aire and Indo1 gene expression on murine ECs. ECs were exposed to Candida albicans and assessed for Aire (A and D), Indo1 (B and E) and Il10 (C and F) gene expression in the presence of Tα1 (A – C) or siPtma (prothymosin alpha) (D – F). ECs were purified from murine intestine as described Citation[40] and stimulated (106) with inactivated Candida yeasts (1:1 ratio), with and without 100 μg/ml of Tα1 (SciClone Pharmaceuticals, Inc) for 12 h at 37°C. ECs were exposed to 1 µM siPtma (Dharmacon RNAi Technologies) for 72 h, as described Citation[42] before the addition of Candida. Gene expression was evaluated by real-time RT-PCR (Stratagene) with specific primers Citation[42]. The Aire primers were as follows: Forward, 5′-CCTGGATTTCTGGAGGATTCTCT-3′; reverse, 5′-CCGTCCAGGATGCTATGCA-3′. *p < 0.05, ‡p < 0.01, §p < 0.001, Tα1-treated versus untreated cells and Aire0/0 versus Aire+/+ cells. The data are pooled from two experiments.](/cms/asset/0d12cc31-69b1-4110-a570-8822fd10bb7c/iebt_a_1044895_f0001_oc.jpg)
Figure 2. Aire controls IDO1 protein expression in vivo. Aire0/0 and Aire+/+ mice on the BALB/c background were injected intragastrically with 108 Candida albicans and assessed a week later for (A) stomach histology by periodic acid-Schiff (PAS) staining (note the presence of abundant inflammatory cells and signs of acanthosis and parakeratosis in the stomachs of Aire0/0) and fungal growth (B), expressed as CFU per organ (mean ± SE). (C) IDO1 expression in mesenteric lymph nodes (immunoblotting was performed with rabbit polyclonal IDO1-specific antibody, as described in Ref. Citation[43]. The positive control consisted of IDO1-expressing MC24 transfectants and the negative control of mock-transfected MC22 cells). Corresponding pixel density ratio was normalized against β-tubulin. ***p = 0.001, Aire0/0 versus Aire+/+ mice. The data reported are from one experiment representative of three with similar results. (D) Stomach histology (PAS staining) is shown and (E) Il17a and Il10 expression shown on stomach total cells from C57BL/6 or Indo–/– mice intragastrically infected with 108 C. albicans, treated with 200 μg/kg/i.p. of Tα1 daily for a week and immediately sacrificed. Images were acquired with a 40× objective. Bars indicate magnification. Data are representative (histology) or pooled from two experiments. *p < 0.01, ‡p < 0.001, Tα1-treated versus untreated (none) mice (naïve, uninfected and untreated mice).
![Figure 2. Aire controls IDO1 protein expression in vivo. Aire0/0 and Aire+/+ mice on the BALB/c background were injected intragastrically with 108 Candida albicans and assessed a week later for (A) stomach histology by periodic acid-Schiff (PAS) staining (note the presence of abundant inflammatory cells and signs of acanthosis and parakeratosis in the stomachs of Aire0/0) and fungal growth (B), expressed as CFU per organ (mean ± SE). (C) IDO1 expression in mesenteric lymph nodes (immunoblotting was performed with rabbit polyclonal IDO1-specific antibody, as described in Ref. Citation[43]. The positive control consisted of IDO1-expressing MC24 transfectants and the negative control of mock-transfected MC22 cells). Corresponding pixel density ratio was normalized against β-tubulin. ***p = 0.001, Aire0/0 versus Aire+/+ mice. The data reported are from one experiment representative of three with similar results. (D) Stomach histology (PAS staining) is shown and (E) Il17a and Il10 expression shown on stomach total cells from C57BL/6 or Indo–/– mice intragastrically infected with 108 C. albicans, treated with 200 μg/kg/i.p. of Tα1 daily for a week and immediately sacrificed. Images were acquired with a 40× objective. Bars indicate magnification. Data are representative (histology) or pooled from two experiments. *p < 0.01, ‡p < 0.001, Tα1-treated versus untreated (none) mice (naïve, uninfected and untreated mice).](/cms/asset/47bbf202-158a-4251-871b-6cd58bb04fac/iebt_a_1044895_f0002_oc.jpg)
Figure 3. Aire promotes Tα1 production. (A) Legumain production in DCs purified from the mesentheric lymph nodes and pulsed for 6 h with live Candida albicans yeasts and hyphae (at the cell:fungi ratio of 1:1) as described Citation[43]. Immunoblotting was done on cell lysates with the anti-legumain specific antibody (Santa Cruz). Corresponding pixel density ratio was normalized against β-actin. (B) Lgmn (Legumain) gene expression by RT-PCR and (C) Tα1 production (by specific ELISA from Immundiagnostik) in Aire0/0 and Aire+/+ mice a week after intragastric infection with 108 C. albicans are shown. Assays were done on stomach total cells or homogenates (pooled from 6 mice). (D) Tα1 production by intestinal ECs is isolated from naïve mice and stimulated with Candida as in legend to ). *p < 0.01, Aire0/0 versus Aire+/+ mice and cells. The data are pooled from two experiments.
![Figure 3. Aire promotes Tα1 production. (A) Legumain production in DCs purified from the mesentheric lymph nodes and pulsed for 6 h with live Candida albicans yeasts and hyphae (at the cell:fungi ratio of 1:1) as described Citation[43]. Immunoblotting was done on cell lysates with the anti-legumain specific antibody (Santa Cruz). Corresponding pixel density ratio was normalized against β-actin. (B) Lgmn (Legumain) gene expression by RT-PCR and (C) Tα1 production (by specific ELISA from Immundiagnostik) in Aire0/0 and Aire+/+ mice a week after intragastric infection with 108 C. albicans are shown. Assays were done on stomach total cells or homogenates (pooled from 6 mice). (D) Tα1 production by intestinal ECs is isolated from naïve mice and stimulated with Candida as in legend to Figure 1). *p < 0.01, Aire0/0 versus Aire+/+ mice and cells. The data are pooled from two experiments.](/cms/asset/93032aaa-6822-4e8f-9f28-dcf66e4961c1/iebt_a_1044895_f0003_oc.jpg)
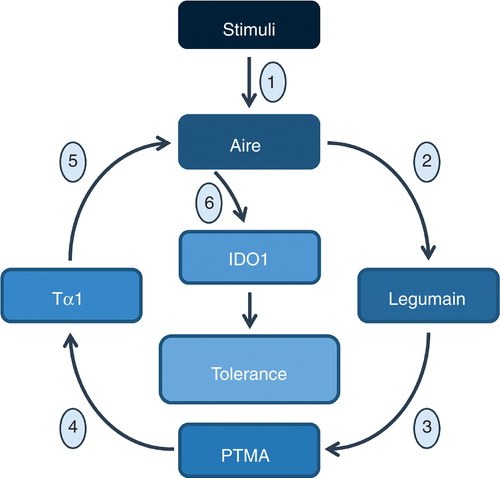
Figure 4. Schematic representation of the possible pathways underlying the Tα1/Aire synergistic crosstalk in tolerance. Induced in infection (1), Aire may activate the asparaginyl endopeptidase legumain activity (2) to PTMA cleavage (3) leading to the production of Tα1 (4) that in turn activates Aire transcription (5) which is required for the activation of the enzyme IDO1 (6).