
Figures & data
Table 1 Solo- and co-teaching faculty
Figure 1 Comparison of attitudes toward solo- and co-teaching (response rate=62%, n=122).
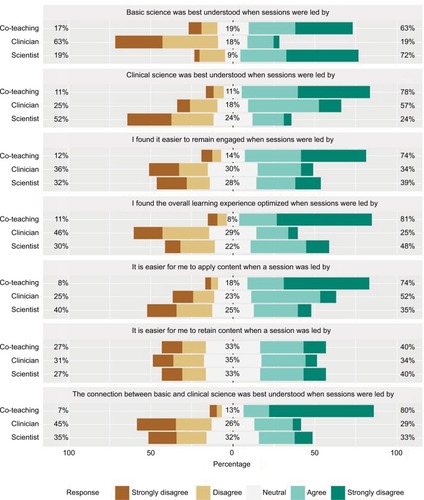
Table 2 Mean rank comparison of co-teaching and solo-teaching
Table 3 Themes from survey of students
Figure 2 Comparison of equated and scaled exam score by teaching type.
Notes:
*statistical significance, p-value <0.05.
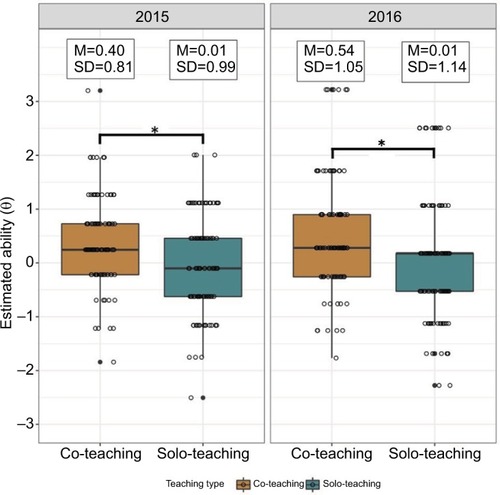
Figure S1 Faculty evaluation.
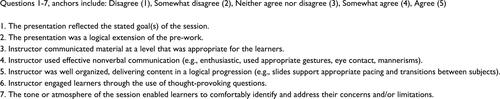
Figure S2 Shared teaching survey.
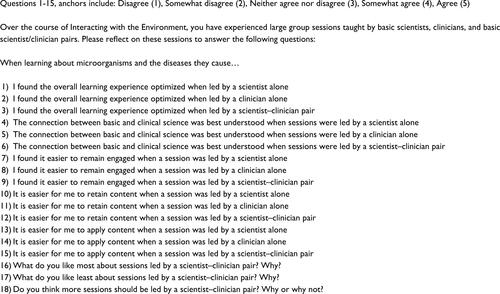
Table S1 Evaluation of teaching performance