Figures & data
Table 1 Demographic Characteristics of the Students (n = 104)
Table 2 Number of Times Students Participated on Different Social Media (Mean ± SD)
Table 3 Difference Between Pre- and Post SMI in Terms of Classroom Attendance, Study Time After Classroom Lecture, and Marks Obtained by All Students (n = 104)
Table 4 Examination Score Difference Between Male and Female Students, Pre-& Post SMI
Table 5 Binary Logistic Regression to Identify the Relationship Between Learning Style and Exam Score Increase After SMI (More Than 10 or Not)
Table 6 Exam Score Pre- and Post-SM Integration, Mark Difference, and Number of Times the Students Participated in Different Social Media
Table 7 Relationship Between SM Using Frequencies and Exam Score Increase
Table 8 True Frequency of SM Use, Percentage of SM Use and True Mark Increase After Each SM Use Based on Frequencies
Figure 1 Educational content delivery through WhatsApp. (A) Shows response of a student on a microscopic image and feedback by the educator. (B) Shows another microscopic image and its features shared by the educator. (C) Shows a gross image. (D) Shows response of several students over a question.
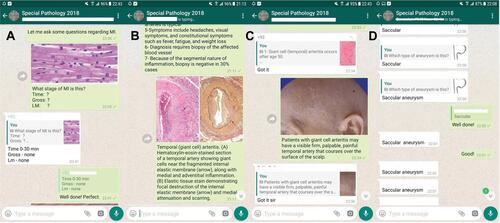
Figure 2 Educational content delivery through social medical platforms. (A) Shows gross image shared on Facebook. (B) Shows a scenario-based question shared on Facebook and the response of a student. (C) Shows a High Yield Facts tweeted on Twitter. (D) Shows a Quizzes posted on Edmodo.
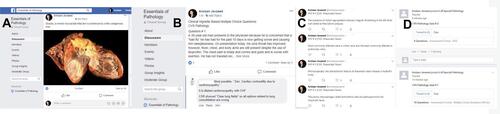
Figure 3 Education level of the parents of the students (percentages) (n = 104).
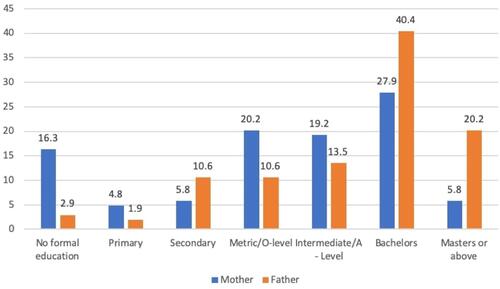
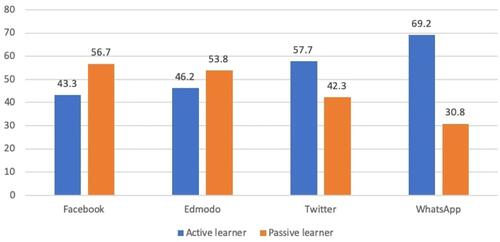
Figure 4 Learner categories (active/passive) in different social media.