Figures & data
Table 1 Grading Scales for Dermatological Assessment for Efficacy
Table 2 Melanogenesis and Tyrosinase Inhibitory Activity and Anti-Collagenase and Anti-Elastase Activity
Figure 1 Skin brightness analysis by spectrophotometer: (A) forehead week 2 vs baseline p=0.04327 and week 4 vs baseline p=0.0498; (B) cheek week 2 vs baseline p=0.0.076 and week 4 vs baseline p=0.0001; (C) upper inner arm - volar biceps: week 2 vs baseline p=0.2948 and week 4 vs baseline p=0.7312; (D) ΔL (VB-FH) week 2 vs baseline p=0.03118and week 4 vs baseline p=0.0219; ΔL VB - Cheeks: week 2 vs baseline p=0.0002and week 4 vs baseline p<0.0001.
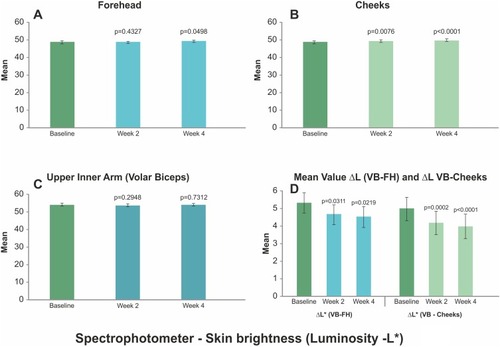
Figure 2 Skin hydration assessment by Corneometer for forehead and cheek at week 2 (day 15), week 4 (day 30) vs baseline all p<0.0001.
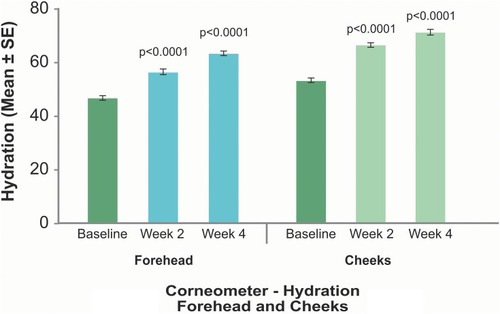
Figure 3 Cutometer assessment of Skin elasticity Gross elasticity: (A) Week 4 vs baseline p<0.0001 and Week 8 vs baseline p<0.0001; Maximum Amplitude of Elasticity: Week 4 vs baseline p<0.0001 and Week 8 vs baseline p<0.0001; Net Elasticity: Week 4 vs baseline p<0.0002 and Week 8 vs baseline p<0.0001; Visco Elasticity: Week 4 vs baseline p=0.2933 and Week 8 vs baseline p<0.0235. (B) Skin evaluation of Fine Lines, Wrinkles and Skin Texture using Antera; Fine lines, Medium and large wrinkles, and skin texture: week 4, week 8 vs baseline all p<0.0001. (C) Dermatological assessment: Mean value for Shade card assessment for skin fairness: for forehead, cheek, untreated control, Forehead vs Untreated control and cheek vs untreated control at Week 2 vs baseline p=0.9999, week 4 vs baseline p<0.0001, and Untreated control week 2 and week 4 vs baseline p=0.9999.
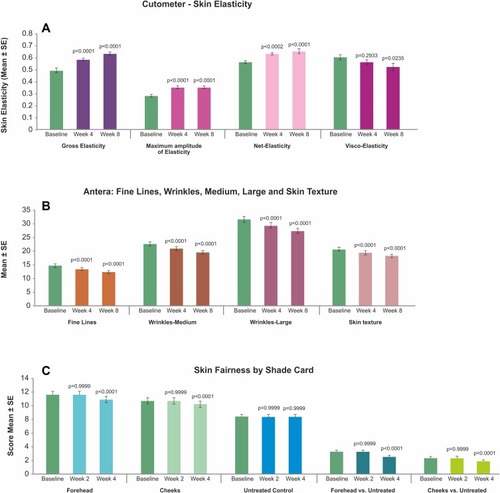
Figure 4 (A) Antera Image of fine lines, medium wrinkles, large wrinkles at baseline, Week 4 (W4) and Week 8 (W8) Right (FR) and Left (FL) side of the face. (B) Visia Image: cross polarized light: front, left, and right view - baseline, Week 4 and Week 8.
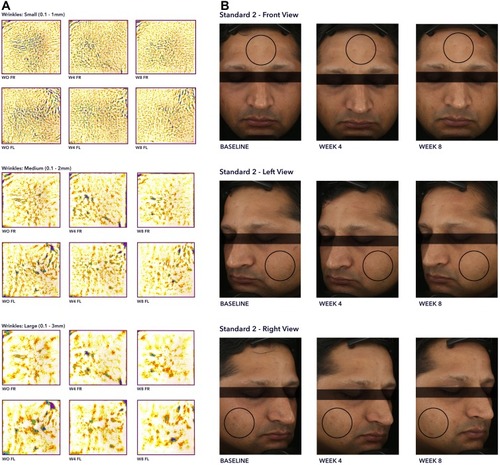
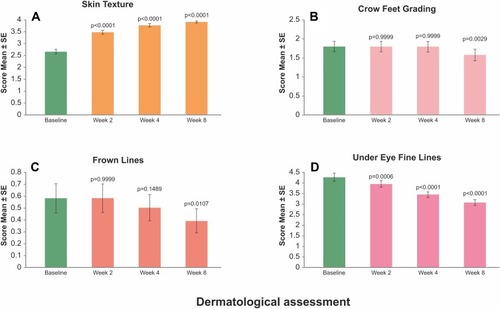
Figure 5 Dermatological assessment. (A) Mean value for skin texture Week 2 p=0.9999, Week 4 p=0.3458, Week 8 p=0.3458. (B) Mean value for crow feet grading Week 2 p=0.9999, Week 4 p=0.9999, Week 8 p=0.0029. (C) Mean value for frown lines Week 2 p=0.9999, Week 4 p=0.1489, Week 8 p=0.0107. (D) Mean value for under eye fine lines Week 2 p=0.0006, Week 4 p=0.0001, Week 8 p=0.0001.