
Figures & data
Figure 3 Forest plot of specificity.
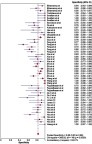
Figure 4 Forest plot of the negative likelihood ratio (NLR).
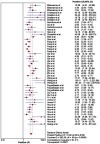
Figure 5 Forest plot of the positive likelihood ratio (PRL).
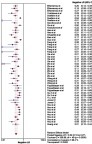
Figure 6 Forest plot of diagnostic odds ratio (DOR).
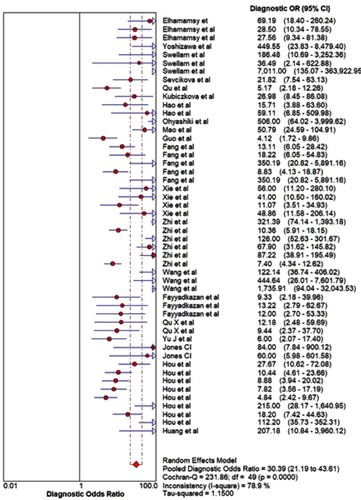
Figure 1 Flowchart of studies selection.
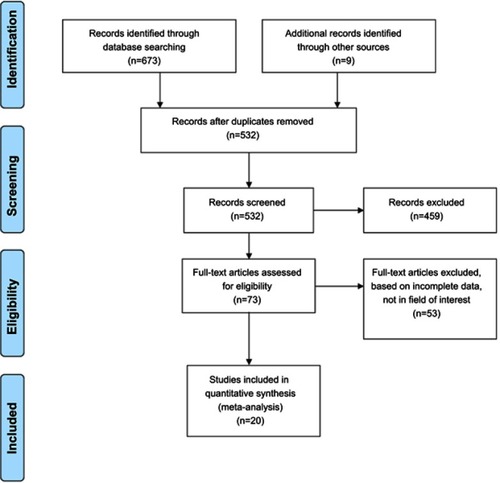
Figure 2 Forest plot of sensitivity.
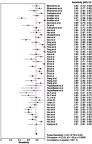
Figure 7 Summary ROC curve for the included studies.
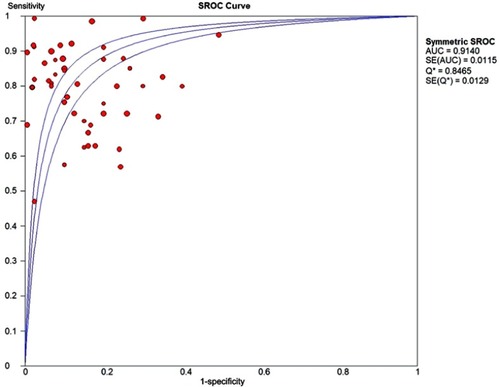
Table 1 Characteristics of included studies
Table 2 Summary of subgroup analysis for circulating miRNA in haematological cancer diagnosis