
Figures & data
Figure 1 Flowchart for study selection and data acquisition.
Notes: The flow diagram explains the information on the different phases of the articles selection criteria in systematic review and side boxes explain the reason why the particular articles were removed. Each excluded articles were defined with appropriate excluded numbers.
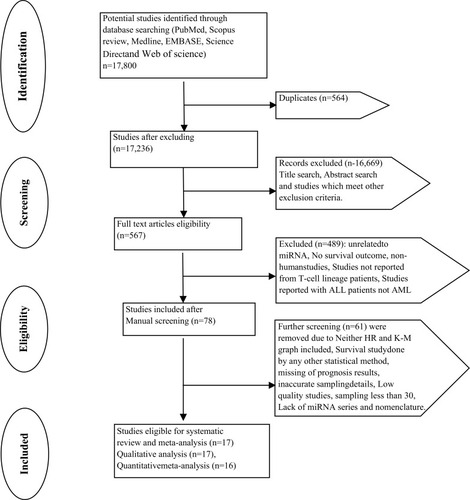
Table 1 Descriptive Characteristics and Related Data from Included Studies
Figure 2 Forest plot for survival outcome of miRNAs in T-ALL patients.
Notes: The pooled hazard ratios of HR values of T-ALL prognostic data were calculated and analysed using CMA software (version 3.3.070, USA). The black diamond represents the combined effect estimate of survival for T-ALL patients randomly assigned to miRNA evaluation. The red square with line indicates the effect size of miRNA of the included studies with 95% confidence interval. The risk ratio of 1 suggests no difference in risk of T-ALL patients’ survival. A risk ratio > 1 indicates an increased risk of patients’ survival, whereas a risk ratio < 1 suggests a reduced risk of patients’ survival. Favours Survival refers to better survival and Favours death indicates worse survival.
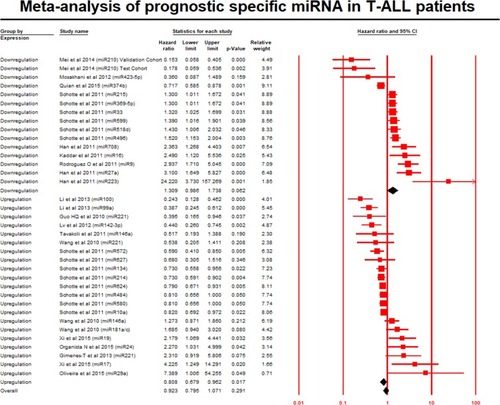
Figure 3 Funnel plot of studies correlating the overall patient survival and miRNA expression.
Notes: The funnel plot measures the study size standard error and precision on the vertical axis and function of effect size on the horizontal axis. The dots represent the individual study, and most of this area contains regions of high significance, which reveals that publication bias would be described in the form of asymmetry. This states the fact that smaller studies which appear toward the bottom are more likely to be published if they have larger than average effects and spreads on the right side of the plot, which makes them more likely to meet the criterion for statistical significance due to non-even distribution of studies.
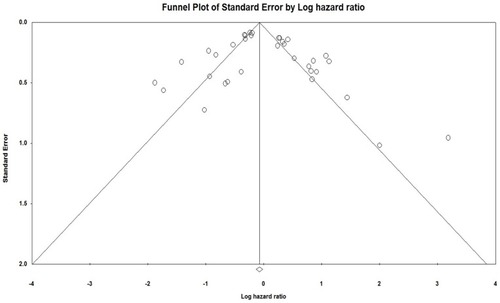
Figure 4 Funnel plot with observed and imputed studies.
Notes: Large studies appear outside the funnel and tend to cluster on one side of the funnel plot. Smaller studies appear toward the top of the graph, and (since there is more sampling variation in effect size estimates in the smaller studies) will be dispersed across a range of values.
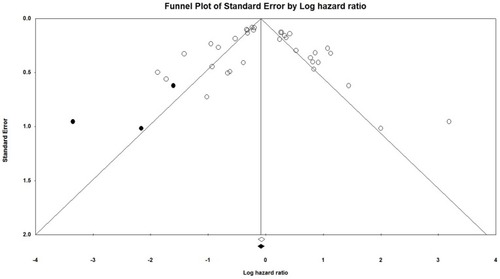
Table 2 Subgroup Analysis of the Demographic Characters, miRNA221 and miRNA146a from the Studies Reporting the miRNA Prognosis in T-ALL Patients
Figure 5 Subgroup analysis on WBC.
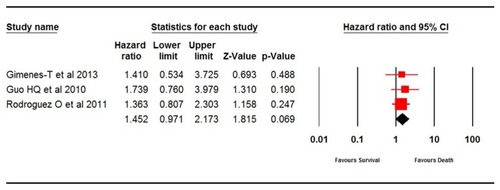
Figure 6 Subgroup analysis for lactate dehydrogenase.
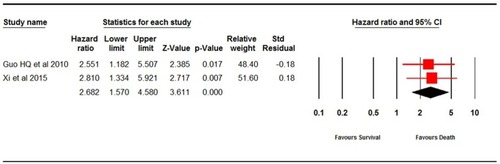
Figure 7 Subgroup analysis for age at diagnosis.
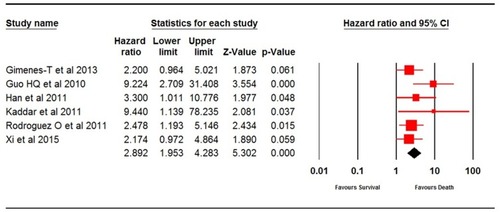
Figure 8 Subgroup analysis for gender variables.
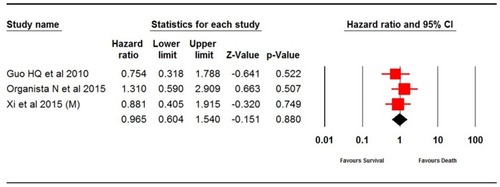
Figure 9 Subgroup analysis of miRNA expression in survival outcome of T-ALL patients exclusively.
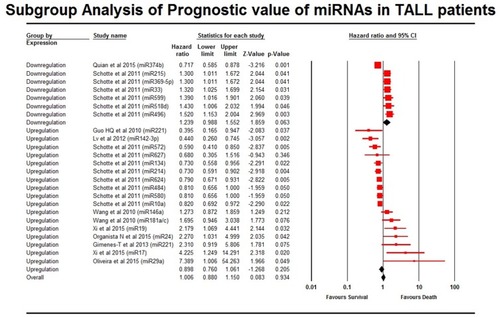
Figure 10 Subgroup analysis of miRNA221.
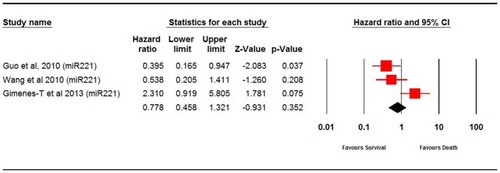
Figure 11 Subgroup analysis of miRNA146a.
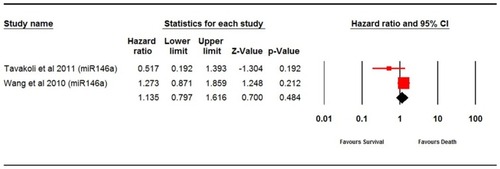
Figure 12 Subgroup analysis on patient's ethnicity.
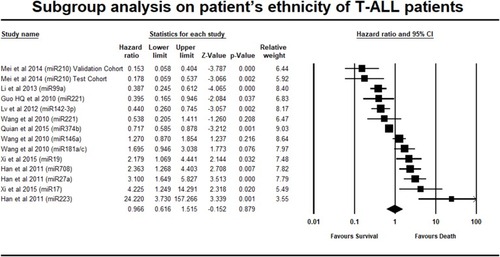
Table 3 Quality Assessment of the Selected Studies