Figures & data
Figure 1 Flow chart of participant inclusion in the study.
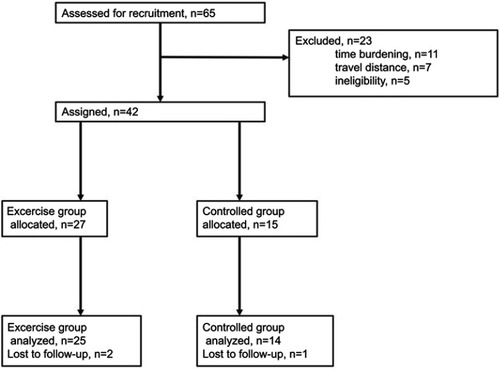
Figure 2 (A and B) Subcutaneous fat area (SFA) and skeletal muscle area (SMA) of cross-sectional images, marked in green and red, respectively, were measured by using Image J (ver. 1.80, National Institutes of Health). (C) Muscle to fat ratio (MFR) was calculated by dividing the SMA by the SFA. MFRs were significantly reduced during the adjuvant treatment in the control group, but not in the exercise group. (D) MFR changes before and after adjuvant treatment were significantly different between the control and exercise groups. *p<0.05.
Abbreviation: N/S, not significant.
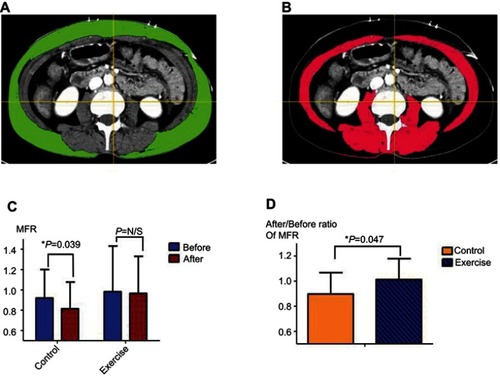
Table 1 Baseline characteristics of the study patients (N=39)
Table 2 Effect of exercise intervention on chemotherapy completion rates and treatment-related toxicities
Table 3 Effect of exercise intervention on body compositions and serum levels of adipokines in patients undergoing adjuvant treatment
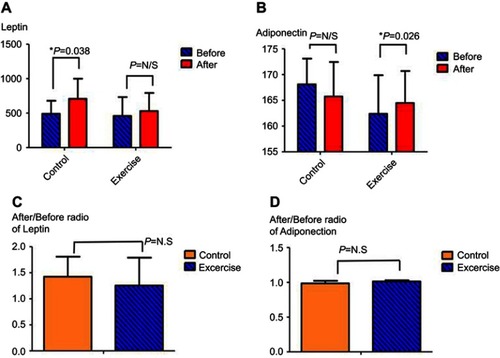
Figure 3 (A) Serum levels of leptin were significantly increased during adjuvant treatment in the control group, but not in the exercise group. (B) Serum levels of adiponectin were significantly increased during adjuvant treatment in the exercise group, but tended to be decreased in the control group. (C and D) Changes in serum levels of both leptin and adiponectin before and after adjuvant treatment were not significantly different between the control and exercise groups. *p<0.05.
Abbreviation: N.S, not significant.