Figures & data
Figure 1 UPK1A-AS1 expression is significantly downregulated in ESCC tissues and cell lines. (A) Heat map analysis of the expression of lncRNAs in GEO120356 database. (B) GEO120356 database revealed that UPK1A-AS1 expression was markedly upregulated in ESCC samples compared with that in corresponding normal samples. (C) qRT-PCR analysis of UPK1A-AS1 expression in 30 pairs of ESCC tissues and corresponding normal tissues. (D) qRT-PCR analysis of UPK1A-AS1 expression in ESCC cell lines (EC109, EC9706, KYSE30, and KYSE150) and human immortalized esophageal epithelial cell line (SHEE). **P < 0.01, ***P < 0.001.
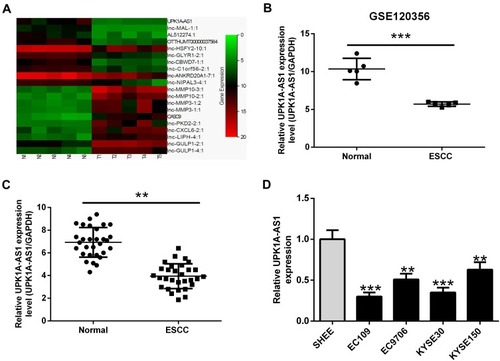
Figure 2 Upregulation of UPK1A-AS1 inhibits ESCC cell proliferation, migration, and invasion. EC109 and KYSE30 cells were transfected with UPK1A-AS1 or vector. (A) qRT-PCR validation of UPK1A-AS1 upregulation in EC109 and KYSE30 cells following transfection with UPK1A-AS1 overexpressing plasmid. (B and C) Cell viability was evaluated at 48 h post-transfection using CCK-8 assay. (D and E) Plate colony formation assay and soft agar colony formation assay of EC109 and KYSE30 cells transfected with UPK1A-AS1 or vector. (F and G) Scratch-healing and transwell invasion assays were performed to assess the migration and invasion of EC109 and KYSE30 cells at 48 h post-transfection, respectively. Scale bar: 200 μM. **P < 0.01, ***P < 0.001.
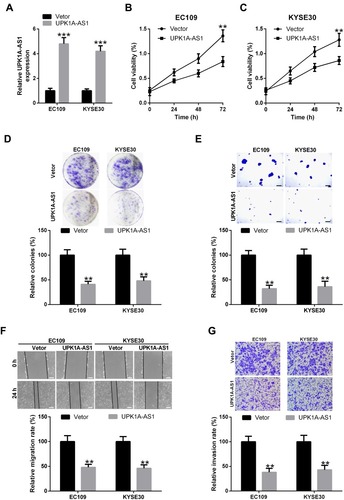
Figure 3 UPK1A-AS1 directly interacts with miR-1248. (A and B) Subcellular localization assay was performed to determine the location of UPK1A-AS1 in EC109 and KYSE30 cells. (C) Schema representing the functional interaction between miR-1248 and UPK1A-AS1 as predicted by DIANA tools LncBase. (D and E) Luciferase reporter activity in EC109 and KYSE30 cells co-transfected with indicated plasmids. (F) qRT-PCR analysis of UPK1A-AS1 expression in RNA pull-down samples. Bio-miR-1248 or Bio-NC was used to pull-down endogenous UPK1A-AS1 from EC109 and KYSE30 cell lysates. (G) qRT-PCR analysis of miR-1248 expression in EC109 and KYSE30 cells after UPK1A-AS1 upregulation. (H) qRT-PCR analysis showing the upregulation of UPK1A-AS1 in ESCC tissues. (I) GSE97051 database revealed that miR-1248 was upregulated in ESCC tissues relative to adjacent normal tissues. (J) Spearman correlation coefficient analysis showing an inverse correlation between UPK1A-AS1 and miR-1248 expression in ESCC specimens. *P < 0.05, **P < 0.01, ***P < 0.001.
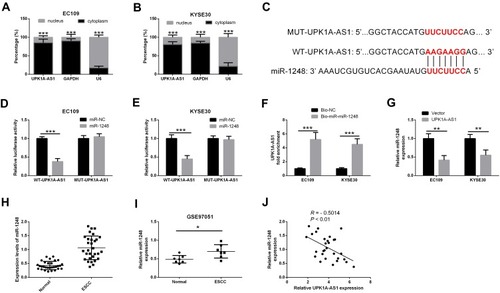
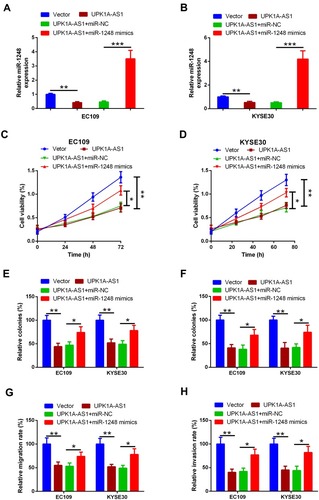
Figure 4 UPK1A-AS1 regulates ESCC cell proliferation, migration, and invasion partially by sponging miR-1248. (A and B) qRT-PCR analysis of miR-1248 expression in EC109 and KYSE30 cells following transfection with UPK1A-AS1 and miR-1248 mimic. (C and D) Results of CCK-8 assay in EC109 and KYSE30 cells transfected with UPK1A-AS1 overexpressing plasmids alone or co-transfected with UPK1A-AS1 overexpressing plasmids and miR-1248 mimic. (E and F) Results of plate colony formation assay and soft agar colony formation assay in EC109 and KYSE30 cells transfected with UPK1A-AS1 alone or with miR-1248 mimic. (G and H) Results of scratch-healing assay in EC109 and KYSE30 cells transfected with UPK1A-AS1 alone or with miR-1248 mimic. (F) Results of transwell invasion assay in EC109 and KYSE30 cells transfected with UPK1A-AS1 alone or with miR-1248 mimic. *P < 0.05, **P < 0.01, ***P < 0.001.