Figures & data
Figure 1 Included patients.
Notes: Patients included in the analysis. Study 1 = clinical Phase 1 study with once-weekly once-daily treatment with oral docetaxel (drinking solution, capsules (ModraDoc001, ModraDoc003, ModraDoc004) and tablets (ModraDoc006) co-administrated with ritonavir.Citation34 Study 2 = clinical phase 1 study with once-weekly bi-daily treatment with oral docetaxel capsules (ModraDoc001) and tablets (ModraDoc006) co-administrated with ritonavir.Citation35
Note: The number N represents the number of patients.
Abbreviations: IV, intravenous; PK, pharmacokinetics.
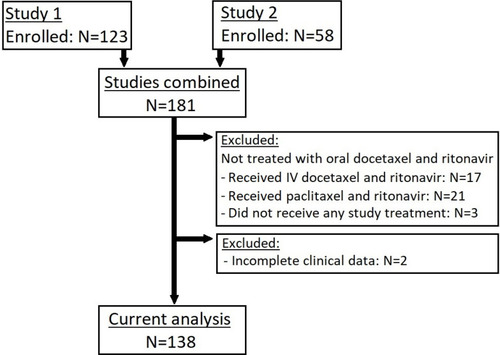
Table 1 Characteristics of the Patients Evaluable for Toxicity
Figure 2 Duration of treatment.
Notes: Duration of continuous weekly treatment with oral docetaxel and ritonavir for 138 patients treated in the two phase I trials. Each row represents one single patient. The color indicates the reason for discontinuation, ie disease progression (blue), disease-related complications (grey), treatment-related toxicity (red) or other reasons (white) such as a switch of the oral docetaxel formulation.
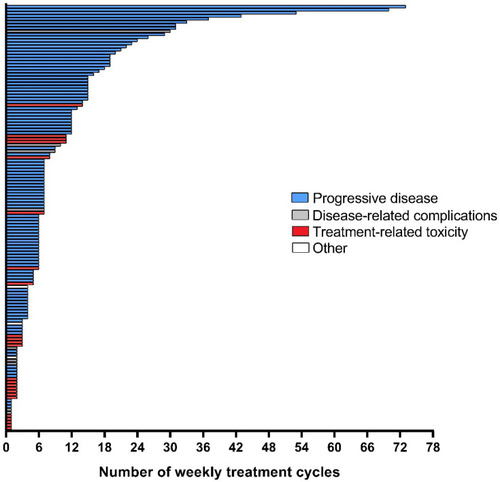
Table 2 Severe Toxicities Related to Oral Docetaxel Co-Administrated with Ritonavir
Figure 3 Correlation of the Cmax and the AUC of docetaxel.
Notes: The relation between the maximum plasma concentration (Cmax) and the area under the plasma concentration versus time curve from zero to infinity (AUC0-inf) of docetaxel for 138 patients treated with oral docetaxel plus ritonavir. For both parameters, the mean results of cycles 1 and 2 of every individual patient were used. The Cmax and AUC0-inf of docetaxel seem correlated, as assessed with the non-parametric Spearman correlation test (r = 0.85).
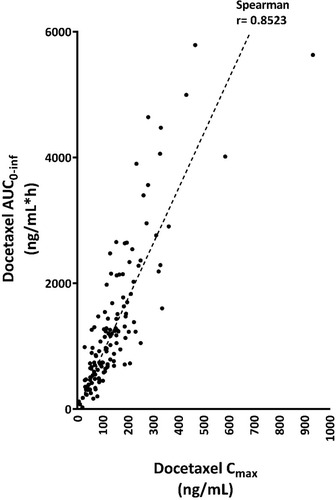
Figure 4 Relation of the exposure to ritonavir versus docetaxel.
Notes: The relation between the AUC of ritonavir versus that of docetaxel for 138 patients treated with oral docetaxel plus ritonavir. For both parameters, the mean results of cycles 1 and 2 of every individual patient were used. The AUC of docetaxel and ritonavir seem correlated, as assessed with the non-parametric Spearman correlation test (r = 0.72).
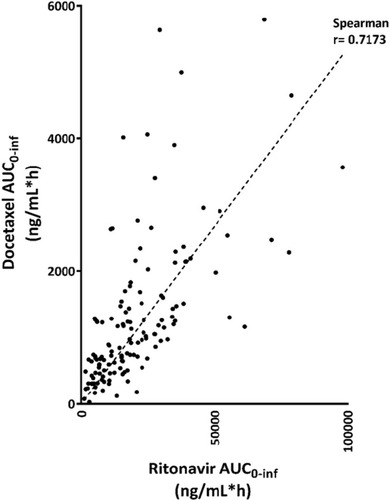
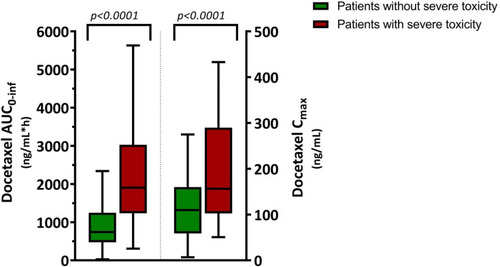
Figure 5 Pharmacokinetic exposure to docetaxel in patients with and without severe toxicity.
Notes: Weekly AUC0-inf (mean of the first two weekly treatment cycles) on the left Y-axis and Cmax of docetaxel on the right Y-axis, in patients without (green boxplots, N=104) and with severe toxicity (red boxplots, N=34). The boxplots show the median AUC0-inf of 1905 (25% percentile 1233 and 75% percentile 3029) for the severe toxicity group (red) and median AUC0-inf of 742 (25% percentile 474 and 75% percentile 1247) ng/mL*h of the group without severe toxicity (green) on the left Y-axis. On the right Y-axis, the median Cmax of 156 (25% percentile 103 and 75% percentile 209) for the severe toxicity group, as compared to the group without severe toxicity with a median Cmax of 110 (25% percentile 59 and 75% percentile 160) ng/mL. Severe toxicity was defined as all CTCAE grade 3 toxicities and/or toxicities of any grade leading to treatment interruption, discontinuation or dose reduction, that were possibly, probably or definitely related to the study treatment. For both PK parameters, the mean was significantly higher (p<0.0001 with two-sided t-test, α=0.05) in the severe toxicity group (mean AUC0-inf 2231 ± standard deviation (SD) 1405 ng/mL*h and mean Cmax 218 ± 178 ng/mL) as compared to the group without severe toxicity (mean AUC0-inf 1011 ± 830 ng/mL*h and mean Cmax 119 ± 77 ng/mL).