Figures & data
Table 1 Brine shrimp lethality assay and antitumor activity of synthesized dexibuprofen amides (4a–j)
Table 2 Anticancer activity of synthesized dexibuprofen amides (4a–j) against breast carcinoma cell line (MCF-7) and human normal epithelial breast cell line (MCF-12A)
Table 3 Ulcerogenic activity of most potent amides 4e and 4g
Figure 1 Overview of crystal structure of BRCA1.
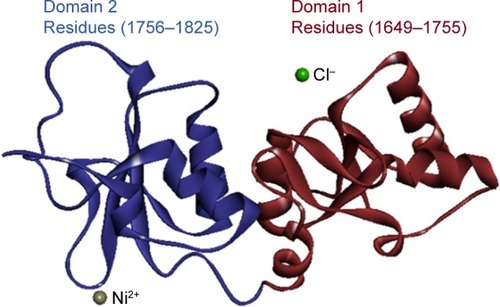
Figure 2 The hierarchical patterns of domains 1 and 2 of target protein BRCA1.
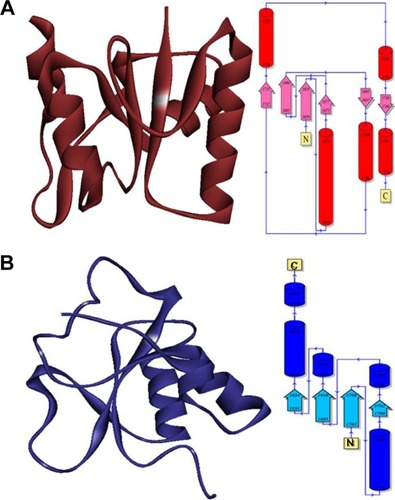
Table 4 Biological properties of synthesized dexibuprofen amides (4a–j)
Table 5 Toxicity risk assessment evaluations of dexibuprofen amides (4a–j)
Table 6 Docking energy evaluation of synthesized amides (4a–j) against BRCA1
Figure 3 Docking complex of 4e against BRCA1.
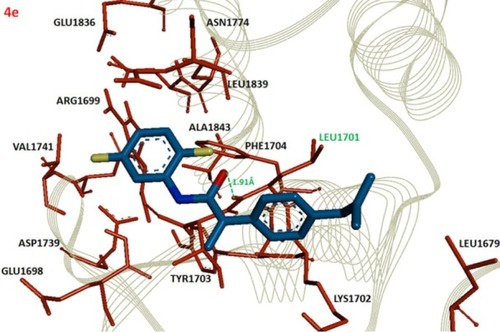
Figure 4 Docking complex of 4g against BRCA1.
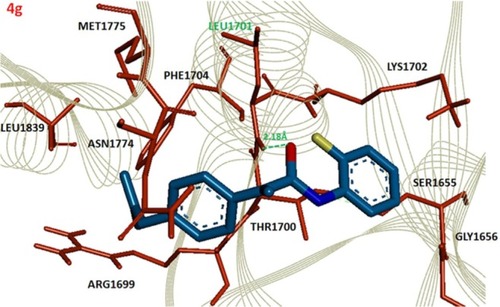
Figure 5 Docking complexes of standard drugs (erlotinib and doxorubicin) against BRAC1.
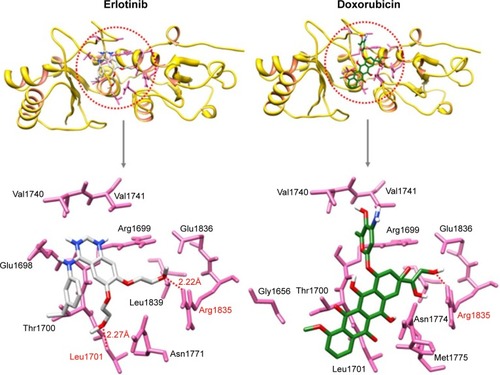
Figure 6 Docking complexes of the synthesized dexibuprofen derivatives 4a–j.
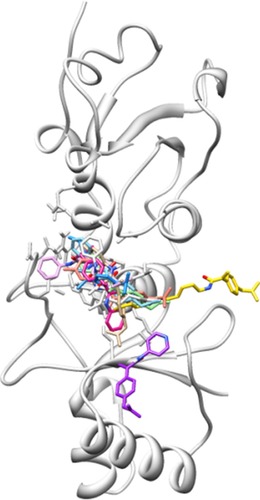
Figure 7 RMSD graphs of 4e and 4g docked complexes are shown in purple and blue respectively from 0–10,000 ps time scale.
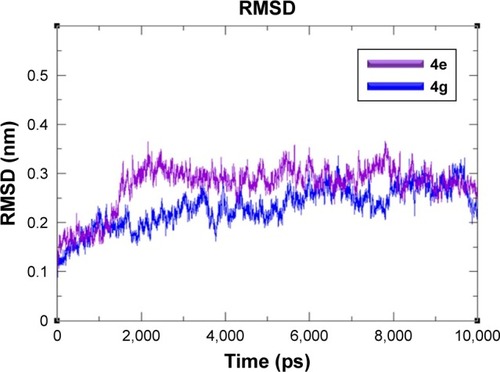
Figure 8 RMSF graphs of 4e and 4g docked complexes are shown in purple and blue respectively from 0–10,000 ps time scale.
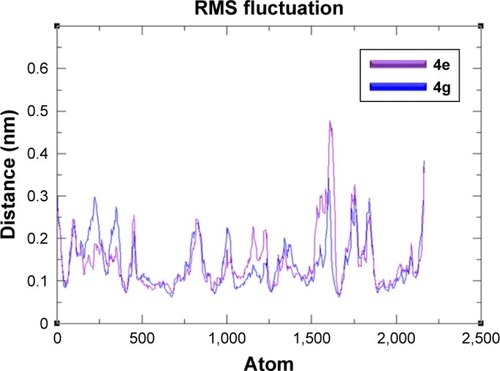
Figure 9 Rg graphs of 4e and 4g docked complexes are shown in purple and blue respectively from 0–10,000 ps time scale.
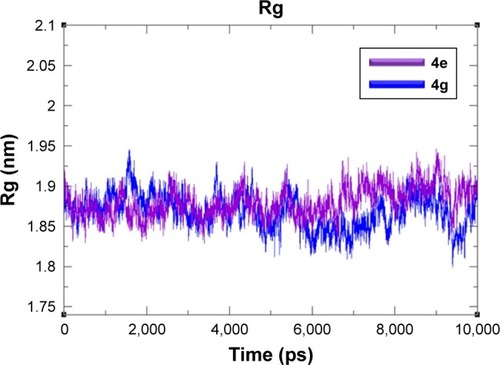
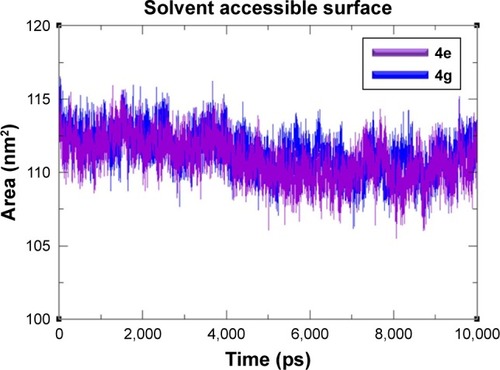
Figure 10 SASA graphs of 4e and 4g docked complexes are shown in purple and blue respectively from 0–10,000 ps time scale.