Figures & data
Table 1 Nucleotide sequences of primers used for PCR
Figure 1 Effects of quercetin on the cell viability of ARPE-19 cells stimulated by TGF-β1.
Notes: (A) The cells were treated with different concentrations of TGF-β1 (0, 2.5, 5, 7.5, 10, 12.5, and 15 ng/mL, respectively) for 24 and 48 hours, and the cell viability was determined by CCK-8 assay. **P<0.01, ***P<0.001, ****P<0.0001 vs the OD value of cells cultured without TGF-β1. (B) Different concentrations of quercetin (0, 25, 50, 60, 75, and 100 µmol/L, respectively) were incubated in ARPE-19 cells for 24 and 48 hours. The cell viability was detected. *P<0.05 vs the control group without quercetin treatment for 24 hours, #P<0.05, ####P<0.0001 vs the cells treated without quercetin for 48 hours. (C) The cells were treated with or without quercetin (50 and 100 µmol/L) in TGF-β1-stimulated ARPE-19 cells for 48 hours, and cell viability was measured using a CCK-8 assay. The data are shown as mean ± SEM; n=3.
Abbreviations: CCK-8, cell counting kit-8; TGF-β, transforming growth factor-β.
Abbreviations: CCK-8, cell counting kit-8; TGF-β, transforming growth factor-β.
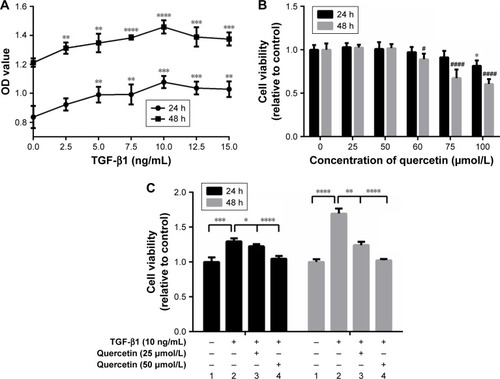
Figure 2 Effects of quercetin on wound closure in TGF-β1-treated RPE cells.
Notes: (A) RPE cells were pretreated with or without 10 ng/mL of TGF-β1 in the absence of 25 or 50 µM quercetin after a scratch. The images were captured at 0, 24, and 48 hours in four groups. The migratory length was calculated according to the scratch at 0 hour. The data are representative of at least three independent experiments. Magnification: ×100. (B) Cell migration data at 24 hours were quantified in wound closure via recording migration length. (C) Cell migration data at 48 hours were quantified in wound closure via recording migration length. The data are shown as mean ± SEM; n=3. **P<0.01, ***P<0.001, ****P<0.0001.
Abbreviations: que, quercetin; RPE, retinal pigment epithelial; TGF-β, transforming growth factor-β.
Abbreviations: que, quercetin; RPE, retinal pigment epithelial; TGF-β, transforming growth factor-β.
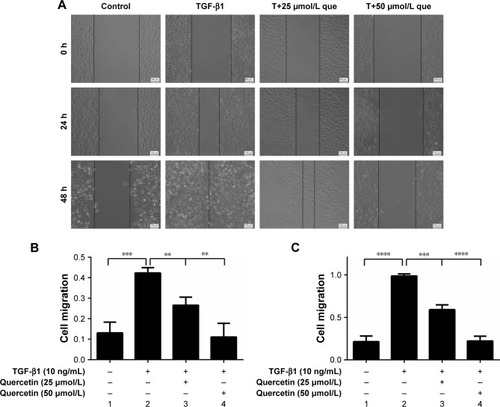
Figure 3 Effects of quercetin on cell migration in TGF-β1-treated RPE cells.
Notes: (A) After treatment with 10 ng/mL of TGF-β1 with or without quercetin (50 and 100 µM) for 48 hours, the migration of RPE cells with different treatments were detected via transwell migration analysis. Migrated cells at 24 h (B) and 48 h (C) were quantified by counting three random vision fields under a microscope. Magnification ×100. The data are shown as mean ± SEM. n=3. **P<0.01, ***P<0.001. Scale bar: 100 µm.
Abbreviations: que, quercetin; RPE, retinal pigment epithelial; TGF-β1, transforming growth factor-β1.
Abbreviations: que, quercetin; RPE, retinal pigment epithelial; TGF-β1, transforming growth factor-β1.
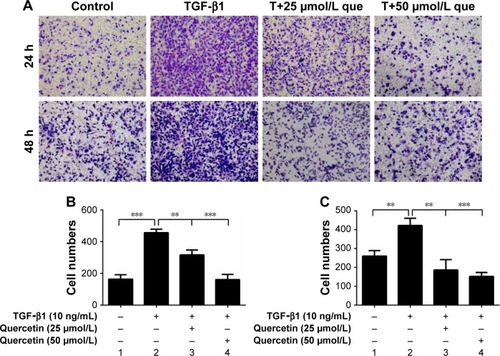
Figure 4 Effect of quercetin on collagen I secretion in TGF-β1-treated RPE cells.
Notes: The supernatants were collected after incubation with or without quercetin and TGF-β1 for 48 hours. The concentration of collagen I was quantified via ELISA. ****P<0.0001.
Abbreviations: RPE, retinal pigment epithelial; TGF-β1, transforming growth factor-β1.
Abbreviations: RPE, retinal pigment epithelial; TGF-β1, transforming growth factor-β1.
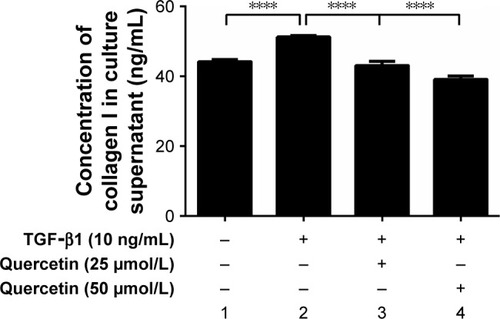
Figure 5 Quercetin suppressed TGF-β1-induced MMP expression in RPE cells.
Notes: (A) The protein levels of MMP-2 and MMP-9 were detected by Western blot in TGF-β1 and quercetin-treated RPE cells for 48 hours. (B and C) Relative protein expression (normalized to GAPDH) was quantified in Western blots via recording gray scale values. (D and E) The mRNA levels of MMP-2 and MMP-9 were detected by real-time PCR. The data are presented as mean ± SEM. n=3. *P<0.05, **P<0.01, ***P<0.001.
Abbreviations: MMP-2, matrix metalloproteinase-2; MMP-9, matrix metalloproteinase-9; que, quercetin; RPE, retinal pigment epithelial; TGF-β1, transforming growth factor-β1.
Abbreviations: MMP-2, matrix metalloproteinase-2; MMP-9, matrix metalloproteinase-9; que, quercetin; RPE, retinal pigment epithelial; TGF-β1, transforming growth factor-β1.
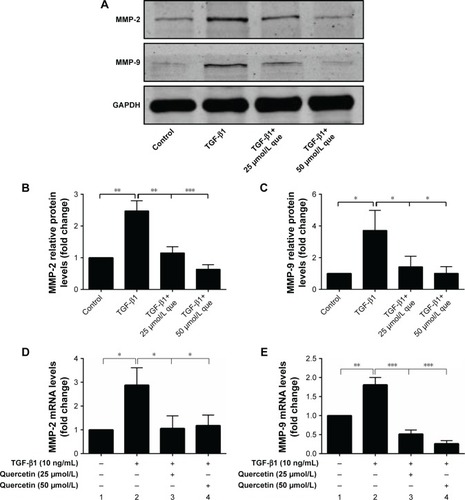
Figure 6 Quercetin suppressed TGF-β1-induced EMT in RPE cells.
Notes: (A) The mRNA levels of EMT marker genes (ZO-1, E-cadherin, N-cadherin, and α-SMA) were detected by real-time PCR. (B) The protein levels of EMT marker (ZO-1, E-cadherin, N-cadherin, and α-SMA) were detected by Western blot in TGF-β1 and quercetin-treated RPE cells for 48 hours. (C) Relative protein expression (normalized to GAPDH) was quantified in Western blots via recording gray scale values. The data are presented as the mean ± SEM. n=3. *P<0.05, **P<0.01, ***P<0.001.
Abbreviations: α-SMA, α-smooth muscle actin; EMT, epithelial–mesenchymal transition; que, quercetin; RPE, retinal pigment epithelial; ZO-1, zonula occludens-1.
Abbreviations: α-SMA, α-smooth muscle actin; EMT, epithelial–mesenchymal transition; que, quercetin; RPE, retinal pigment epithelial; ZO-1, zonula occludens-1.
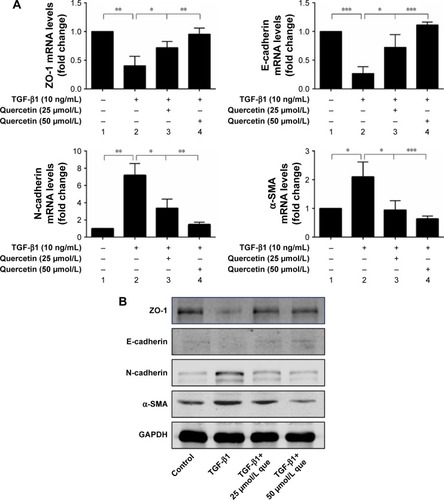
Figure 7 Immunofluorescence analysis of EMT-related proteins in ARPE-19 cells.
Notes: After RPE cells were treated with 10 ng/mL of TGF-β1 with or without quercetin (50 and 100 µM) for 48 hours, ZO-1, E-cadherin, N-cadherin, and α-SMA were detected using the primary antibody. DAPI was incubated to detect nuclei. The photos were recorded by confocal microscopy. Original magnification: 630×, oil. Scale bar: 10 µm. Top to bottom: ZO-1.
Abbreviations: α-SMA, α-smooth muscle actin; Ecad, E-cadherin; EMT, epithelial–mesenchymal transition; Ncad, N-cadherin; que, quercetin; RPE, retinal pigment epithelial; TGF-β1, transforming growth factor-β1; ZO-1, zonula occludens-1.
Abbreviations: α-SMA, α-smooth muscle actin; Ecad, E-cadherin; EMT, epithelial–mesenchymal transition; Ncad, N-cadherin; que, quercetin; RPE, retinal pigment epithelial; TGF-β1, transforming growth factor-β1; ZO-1, zonula occludens-1.
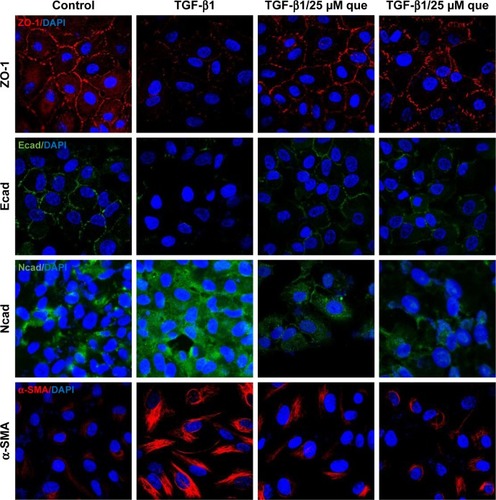
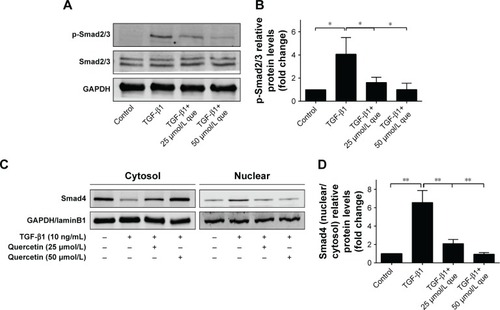
Figure 8 Quercetin attenuates TGF-β1-induced Smad2/3 phosphorylation and nuclear translocation of Smad4 in RPE cells.
Notes: (A) The protein levels of p-smad2/3 were detected via Western blot in RPE cells treated with or without quercetin and TGF-β1 for 48 hours. (B) Quantitative data for p-Smad2/3 relative protein levels are calculated based on the expression of Smad2/3. (C) The protein levels of Smad4 in both cytoplasm and nucleus were detected via Western blot. (D) Quantitative data for Smad4 (nuclear vs cytosol ratio) relative protein levels are calculated. The results are presented as mean ± SEM. *P<0.05, **P<0.01.
Abbreviations: que, quercetin; RPE, retinal pigment epithelial; TGF-β1, transforming growth factor-β1.
Abbreviations: que, quercetin; RPE, retinal pigment epithelial; TGF-β1, transforming growth factor-β1.