Figures & data
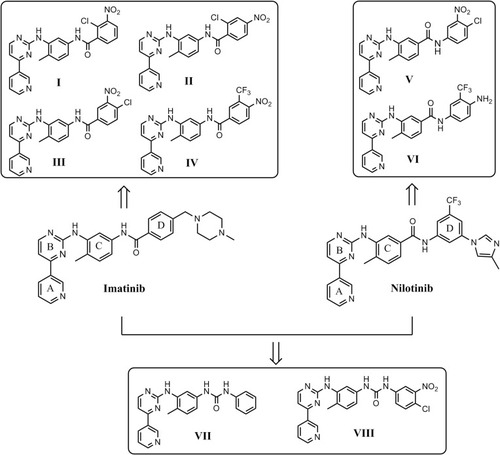
Figure 1 Modifications of prepared imatinib and nilotinib derivatives. Upper panel left: Following removal of the piperazinyl ring of imatinib, modifications were made to the final phenyl moiety as shown (I–IV). Upper panel right: Removal of the imidazolyl ring, modifications were made to the final phenyl ring (V, VI). Lower panel: Structure of the imatinib or nilotinib analogues by replacement of the amide bond with the urea moiety (VII, VIII).
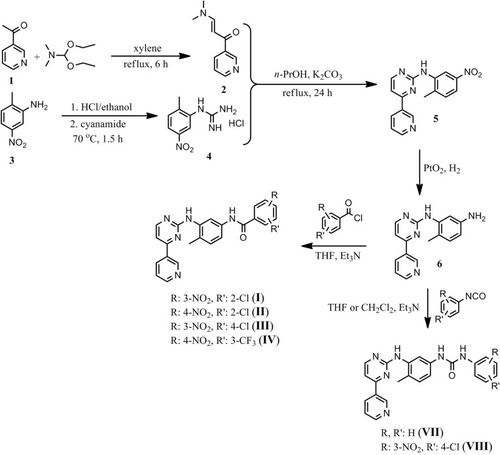
Scheme 1 Reactions and conditions for the synthesis of the imatinib I–IV and of the imatinib/nilotinib analogues VII and VIII.
Scheme 2 Reactions and conditions for the synthesis of the nilotinib analogues V and VI.
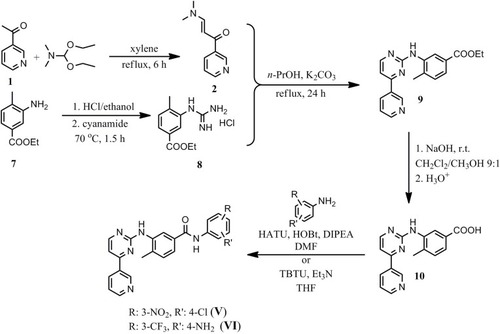
Table 1 The Inhibitory Effect of Imatinib, Nilotinib and Their Synthetic Analogues on AA-Induced Platelet Aggregation in PRP
Figure 2 (A). Bar graph illustrating the % inhibition induced by imatinib (Im), nilotinib (N) and related synthetic analogues (at a concentration of 100 μΜ) on platelet aggregation induced by ADP or TRAP-6. Values represent the Mean±SD from three different platelet preparations. (B). Representative aggregation curves illustrating the inhibitory effect of compound V, at different concentrations, on platelet aggregation induced by i. AA ii. ADP, iii. TRAP-6.
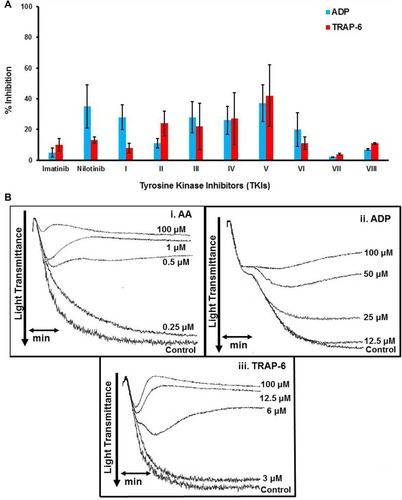
Figure 3 Bar graphs illustrating the effect of imatinib, nilotinib and synthetic compound V on P-selectin membrane expression induced by the platelet agonists (A) AA, (B) ADP and (C) TRAP-6. Platelets in PRP were labeled with anti-CD62P-PE monoclonal antibody and analyzed by flow cytometry to determine the membrane expression of P-selectin on activated platelets. The compounds imatinib, nilotinib and V were used at the concentration of 100 μΜ.
Abbreviations: AA, Arachidonic Acid; ADP, Adenosine Diphosphate; MFI, Mean Fluorescence Intensity; PRP, Platelet-Rich Plasma; SD, Standard Deviation; TRAP-6, Thrombin Receptor Activating Peptide-6.
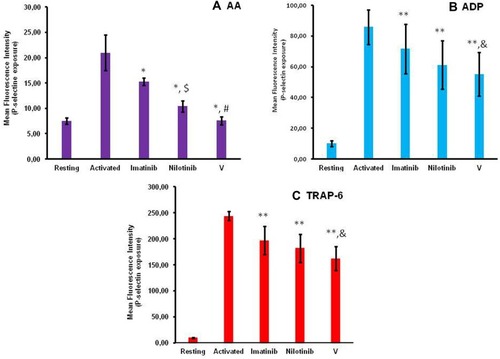
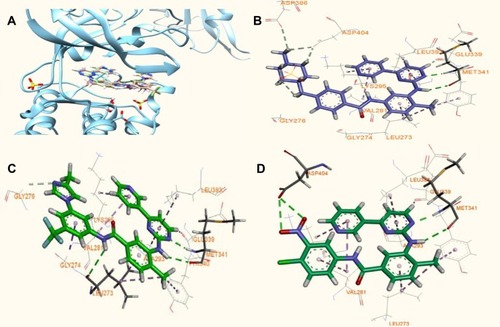
Figure 4 Models of imatinib, nilotinib and of the most active analogue V bound to c-Src enzyme based on PDB (ID: 1Υ57): (A) Superposition of the model of the V-c-Src (in green) and the structures of nilotinib (in brown), imatinib (in pink) at the active site of the kinase c-Src. The differentiations are focused mainly on the final phenyl moiety. (B, C, D) Modeled binding modes presented as 2D ligand-interaction ligand (LID) of imatinib, nilotinib and compound V bound, respectively, positioned at the active site of the kinase c-Src, as derived from flexible docking calculations.