Figures & data
Figure 1 LG25 inhibited cell growth, colony formation, and migration of TNBC cells. (A) The chemical structure of indole-2-carboxamide derivative LG25. (B) Viability of TNBC cells following exposure to LG25. MDA-MB-231 and BT-549 cells were treated with increasing concentrations of LG25 (0.5, 0.75, 1, 1.25, 2.5, 5 or 10 μM), paclitaxel (PTX, 5 μM) or vehicle control (DMSO, 1 μL) for 24 hrs. IC50 values in MBA-MB-231 and BT-549 were obtained using GraphPad Prism 7.0. Data are shown as mean ± SEM (n=3). (C) Inhibitory effects of LG25 on the colony formation ability of TNBC cells. MDA-MB-231 and BT-549 cells were treated with LG25 at 1.25, 2.5, or 5 μM, paclitaxel at 5 μM, or vehicle control (DMSO, 1 μL) for 12 hrs. After treatments, cells were cultured for 15 days in drug-free medium. Colonies were stained with crystal violet staining. (D) MDA-MB-231 cells were treated with LG25 at 0.63, 1.25 or 2.5 μM, paclitaxel at 5 μM, or vehicle control (DMSO, 1 μL) for 24 hrs. The migratory capacity of cells was then assessed. Quantification of the scratch assay is shown in Supplementary Figure S1.
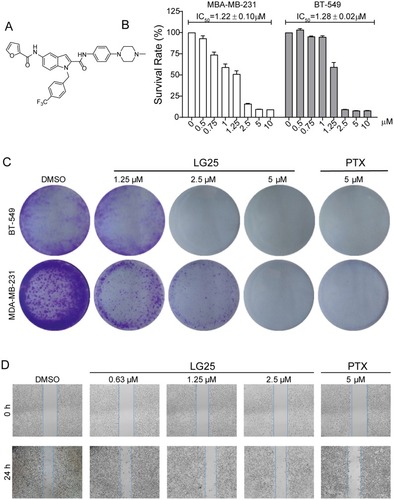
Figure 2 LG25 causes G2/M cell cycle arrest. (A) MDA-MB-231 and BT-549 cells were treated with LG25 at 1.25, 2.5, or 5 μM, paclitaxel at 5 μM, or DMSO vehicle control for 16 hrs. Cell cycle distribution was determined using flow cytometry. Representative images of three independent experiments are shown. The percentage of cells at different cell cycle phases was determined (B–C). (D) MDA-MB-231 cells were treated as outlined in panel A. Levels of G2/M-associated proteins MDM-2 (E), CDC-2 (F), and Cyclin B1 (G) were determined by Western blotting. GAPDH was used as the loading control. Representative Western blots from three independent experiments and quantitative data were shown. Data were shown as mean ± SEM (n=3). *P < 0.05; **P < 0.01 compared to vehicle control.
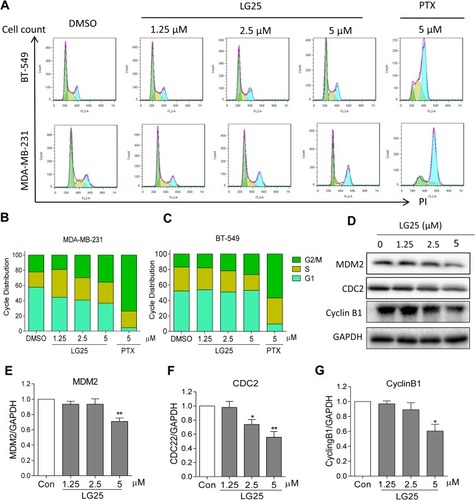
Figure 3 L25 induces apoptosis in TNBC cells. (A) Induction of early and late apoptosis in TNBC cells was determined by staining cells with Annexin V/PI following treatment with LG25. (B, C) Quantification of data shown in panel A. Data presented as means ± SEM from three experiments. (D) MDA-MB-231 cells were treated with LG25 at 1.25, 2.5 or 5 µM, or DMSO vehicle control for 24 hrs. Protein levels of Bcl-2 and Bax were determined by Western blotting. GAPDH was used as loading control. (E, F) Densitometric quantification of Western blot data presented in panel D. Data presented as mean ± SEM from three experiments. *P < 0.05; ***P < 0.001 compared to vehicle control group; #P < 0.05; ###P < 0.001 compared to LG25-5 µM treated group.
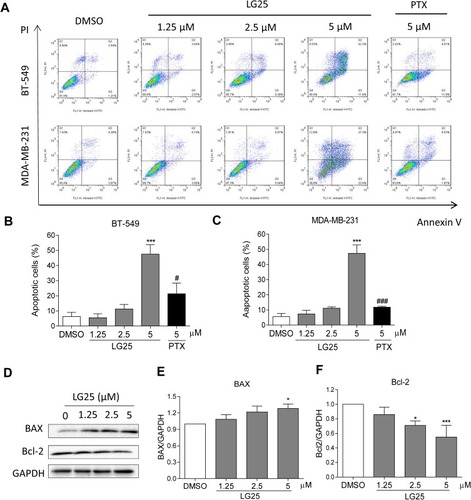
Figure 4 LG25 inhibited the activation of Akt/mTOR and NF-κB signalling pathways. (A) MDA-MB-231 cells were treated with LG25 for 2 hrs. Protein levels of p-mTOR, p-Akt, Akt, and p-S6RP were evaluated by Western blotting. GAPDH was used as the loading control. (B–D) Densitometric quantification of p-mTOR, p-Akt, and pS6RP levels. Data presented as mean ± SEM from three independent experiments. *P < 0.05; **P < 0.01 compared to vehicle control group. (E) MDA-MB-231 cells were treated with LG25 for 6 hrs. The protein levels of NF-κB and IκB-α in nuclear and cytosolic fractions were evaluated by Western blotting. Lamin B1 was used as loading control for nuclear proteins and GAPDH for cytosolic proteins. (G–H) Densitometric quantification of cytosolic IκB and nuclear NF-κB for (E) and (F). Data presented as means ± SEM from three experiments. *P < 0.05; **P < 0.01; ***P < 0.001 compared to vehicle control.
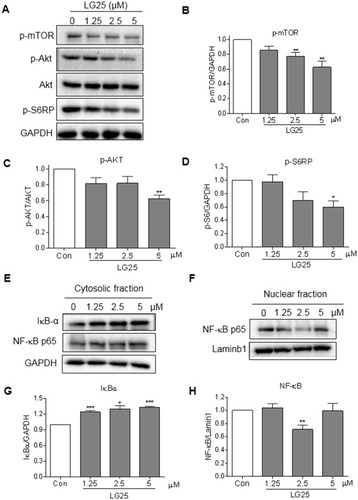
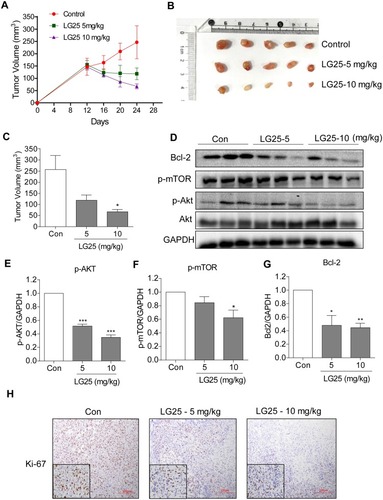
Figure 5 LG25 inhibited MDA-MB-231 tumor growth in mice by suppressing Akt/mTOR signalling. MDA-MB-231 cells were injected subcutaneously into the right flank of the BALB/c nude female mice. Mice were then treated with LG25 for 12 days. (A) Tumour volumes measured at indicated time points in the experimental groups (n=5). (B) Image showing harvested tumor specimens at the conclusion of the study (day 24). (C) Tumor volumes at the conclusion of the study. Data were presented as mean ± SEM (n=5). (D) Western blotting analysis of Bcl-2, p-mTOR, and p-Akt protein expression in tumor tissues from mice. GAPDH was used as loading control. (E–G) Densitometric quantification of Bcl-2, p-Akt, and p-mTOR. Data are shown as mean ± SEM (n=5). *P < 0.05; **P < 0.01; ***P < 0.001 compared to vehicle control group. (H) Immunohistochemical staining for Ki67 in tumor tissues (shown as brown). Slides were counterstained with hematoxylin (blue). Representative photos are shown.