Figures & data
Figure 1 The reaction scheme and 1H NMR spectrum of LAC-ADH-PEG-PCL. LAC-ADH-PEG-PCL were synthesized by conjugating lactobionic acid, ADH, and PCL-PEG-CHO.
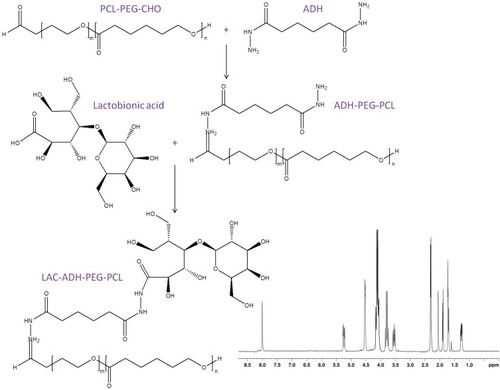
Table 1 Characterization of SLNs (Mean ± SD, n=3)
Figure 2 TEM images of LAC-SFN/CCM-NPs, SFN/CCM-NPs, LAC-SFN-NPs, and LAC-CCM-NPs. LAC-SFN/CCM-NPs are spherical particles with light coats on the surface, while SFN/CCM-NPs showed uniform particles with smooth surfaces.
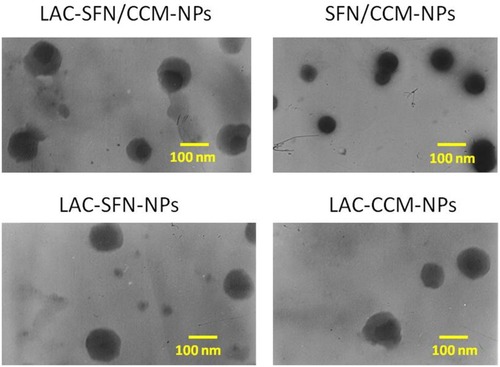
Figure 3 The stability of nanoparticles evaluated by the size (A), PDI (B), SFN EE (C) and CCM EE (D) for a period of 6 months. The nanoparticles systems maintained stable if they showed no obvious changes in size, size distribution, and drug encapsulation efficiency.
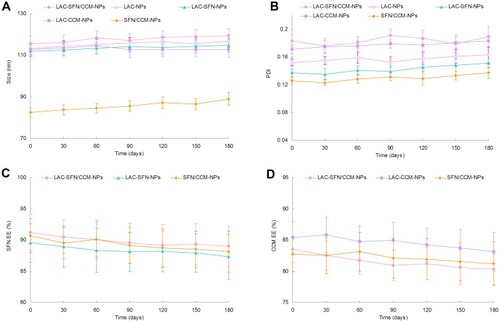
Figure 4 In vitro SFN (A) and CCM (B) release of nanoparticles preformed in pH 7.4 and 5.5. The drug release of LAC-SFN/CCM-NPs in pH 5.5 was more efficient than in pH 7.4. At the end of study, over 80% of drugs were released from LAC-SFN/CCM-NPs in pH 5.5, while drugs release in pH 7.4 was less than 60%. Data represent mean ± SD, *means P < 0.05.
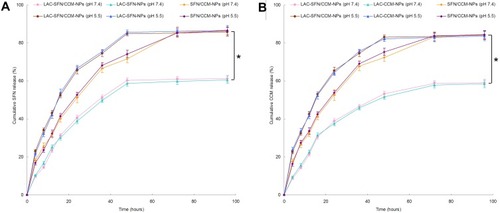
Figure 5 In vitro cytotoxicity of LAC-SFN/CCM-NPs, LAC-NPs, LAC-SFN-NPs, LAC-CCM-NPs, SFN/CCM-NPs, and free SFN/CCM tested on HepG2 cells (A) and CI50 values investigation (B). LAC-SFN/CCM-NPs showed remarkably higher cytotoxicity than SFN/CCM-NPs, LAC-SFN-NPs and LAC-CCM-NPs. CI50 value <1 when the percentage of affected cells was between 20 and 80%, showing the synergy effects of SFN and CCM. Data represent mean ± SD, *means P < 0.05.
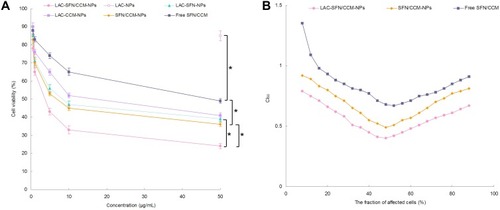
Figure 6 Cellular uptake efficiency of the coumarin 6-loaded nanoparticles in HepG2 cells. Data represent mean ± SD, *means P < 0.05.
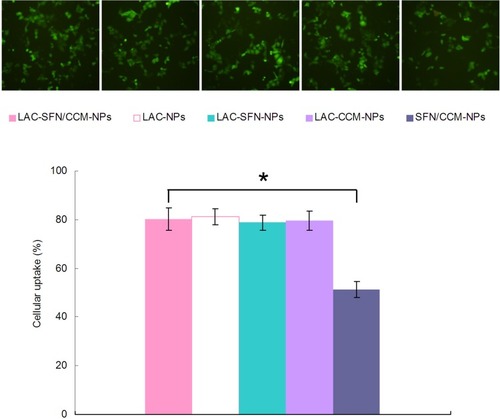
Figure 7 Tumor volumes of HCC tumor tumor-bearing mice (A), the tumor images (B) and the inhibition rate (C). LAC-SFN/CCM-NPs is the most effective treatment in reducing the tumor volume than non-modified, single drug contained nanoparticles, and free drugs.
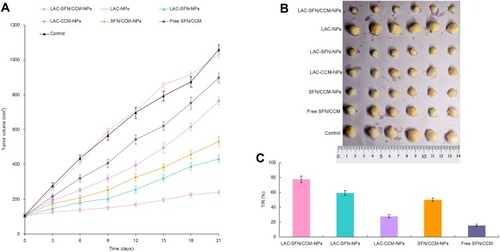
Figure 8 In vivo tissue SFN (A, C) and CCM (B & (D) distribution at 1 and 24 hrs. The SFN and CCM distributions of LAC-SFN/CCM-NPs in tumor and liver were higher than that of SFN/CCM-NPs and free SFN/CCM. Data represent mean ± SD, *means P < 0.05.
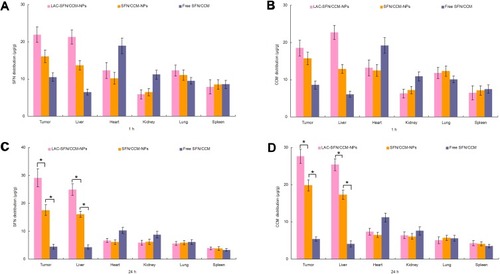
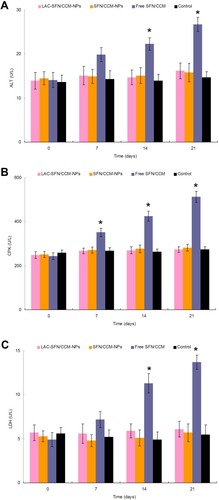
Figure 9 ALT (A), CPK (B), and LDH (C) levels of mice analyzed to determine the tolerance of nanoparticles in vivo. Mice treated with LAC-SFN/CCM-NPs and SFN/CCM-NPs showed a negligible change of those enzymes and markers over the control group. Data represent mean ± SD, *means P < 0.05 compared with control.