Figures & data
Figure 1 miR-133a-3p targets EGFR 3ʹ-UTR. There were binding sites for miR-133a-3p on EGFR 3ʹ-UTR (A). miR-133a-3p mimics significantly decreased the luciferase activity when co-transfected with pGL3-EGFR-WT (B). **p<0.01.
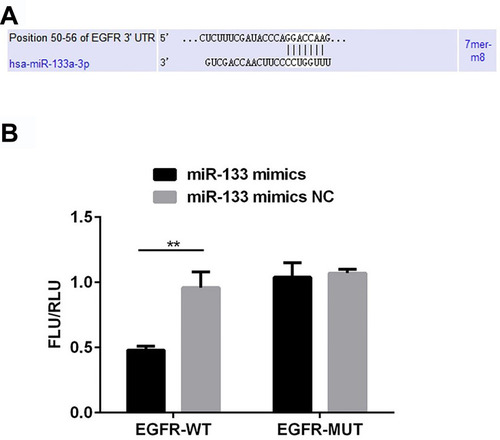
Figure 2 miR-133a-3p was decreased and EGFR was increased in H2O2-induced H9c2 cells. Compared with control group, miR-133a-3p level was significantly lower in H2O2 group, which was reversed by Tan IIA (A). Compared with control group, EGFR level was significantly increased by H2O2, which was reduced by Tan IIA in H9c2 cells (B). ***p<0.001.
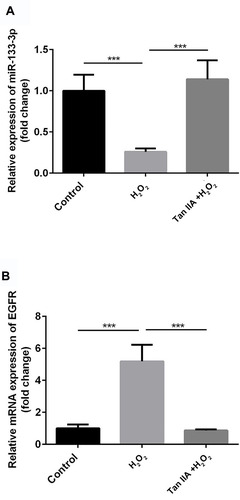
Figure 3 The successful transfection of miR-133a-3p inhibitor and siRNA-EGFR. Compared with control group, miR-133a-3p level was significantly inhibited by miR-133a-3p inhibitor but not miR-NC inhibitor (A). Compared with control group, EGFR level was significantly reduced by siRNA-EGFR-1and siRNA-EGFR-2 but not siRNA-NC (B). ***p<0.001.
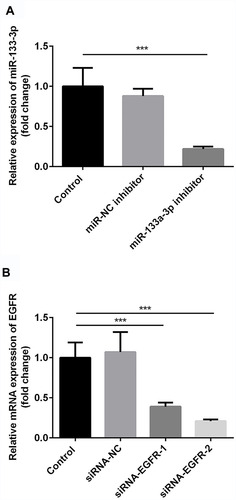
Figure 4 miR-133a-3p inhibitor negatively regulated and siRNA-EGFR positively regulated the expression of EGFR. Compared with miR-NC inhibitor group, a significant increase of mRNA level of EGFR was found in miR-133a-3p inhibitor group, which was reversed by siRNA-EGFR (A). Compared with miR-NC inhibitor group, protein level of EGFR was upregulated by inhibition of miR-133a-3p, which was reversed by siRNA-EGFR (B). **p<0.01, *p<0.05.
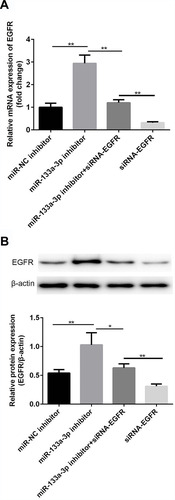
Figure 5 Tan IIA reversed H2O2-induced H9c2 cell proliferation reduction by miR-133a-3p/EGFR axis. Results of CCK-8 (A) analysis showed Tan IIA reversed H2O2-induced H9c2 cell proliferation reduction, which was partially attenuated by miR-133a-3p inhibitor but not miR-133a-3p inhibitor+siRNA-EGFR (A). *p<0.05 and **p<0.01. Results of EdU staining showed that Tan IIA reversed cell proliferation decreased in H2O2-induced H9c2 cells, which was partially rescued by miR-133a-3p inhibitor but not in miR-133a-3p inhibitor+siRNA-EGFR group (B). Quantified results of B (C). *p<0.05 and **p<0.01. Western blot analysis indicated that the expressions of p21 and p53 showed the opposite trends (D). Quantified results of D (E). **p<0.01 and ***p<0.001.
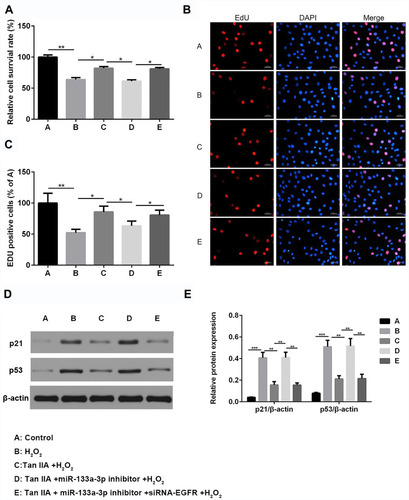
Figure 6 Flow cytometry results showed Tan IIA protected H2O2-induced H9c2 cells from apoptosis by miR-133a-3p/EGFR axis. Results of FCM analysis showed Tan IIA protected H2O2-induced H9c2 cells from apoptosis, which was partially attenuated by miR-133a-3p inhibitor but not miR-133a-3p inhibitor+siRNA-EGFR. *p<0.05, **p<0.01.
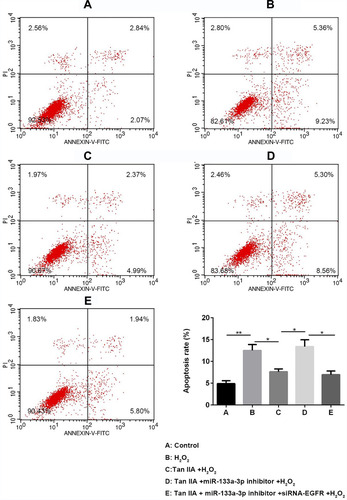
Figure 7 Tunnel staining results showed Tan IIA protected H2O2-induced H9c2 cells from apoptosis by miR-133a-3p/EGFR axis. Results of TUNNEL analysis showed Tan IIA protected H2O2-induced H9c2 cells from apoptosis, which was partially attenuated by miR-133a-3p inhibitor but not miR-133a-3p inhibitor+siRNA-EGFR. **p<0.01, ***p<0.001.
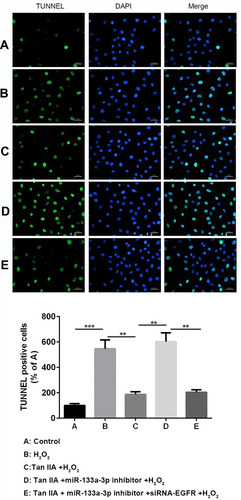
Figure 8 Tan IIA reversed H2O2-induced changes in the expressions of apoptosis and cell cycle-related proteins of H9c2 cells by miR-133a-3p/EGFR axis. The expression profile of cleaved caspase-3 and Bax showed the similar trends to cell apoptosis; while Bcl-2 showed the opposite trends. The expression profile of CyclinD1 and CDK4 exhibited the similar trends with that of cell cycle. **p<0.01, ***p<0.001.
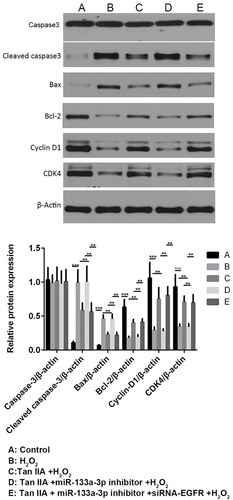
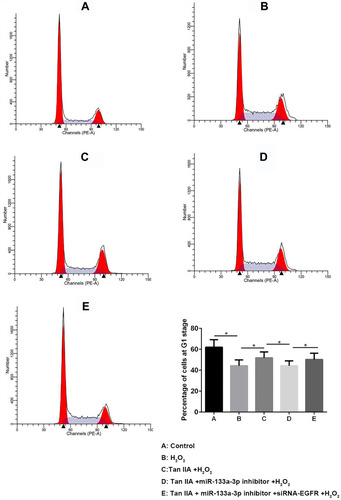
Figure 9 Tan IIA reversed H2O2-induced G0/G1 phase reduction of H9c2 cells by miR-133a-3p/EGFR axis. Tan IIA reversed H2O2-induced G0/G1 phase reduction of H9c2 cells, which was partially attenuated by miR-133 inhibitor but not miR-133a-3p inhibitor +siRNA-EGFR. *p<0.05.