Figures & data
Table 1 Characterization of the Prepared RVT-HSA NPs
Figure 1 (A) The basic structure of RGD-RVT-HSA NPs. The transmission electron microscope of RGD-RVT-HSA NPs (B) and RVT-HSA NPs (C). (Magnification ×100,000).
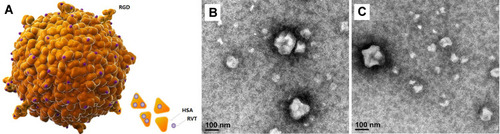
Figure 2 Cumulative drug release (mean ± SD %, n = 6) profiles of free RVT, RVT-HSA NPs, RGD-RVT-HSA NPs and RGD-RVT-HSA NPs (3m) over time intervals of 2, 4, 8, 12, 24, 48, 72, 96, and 120 h.
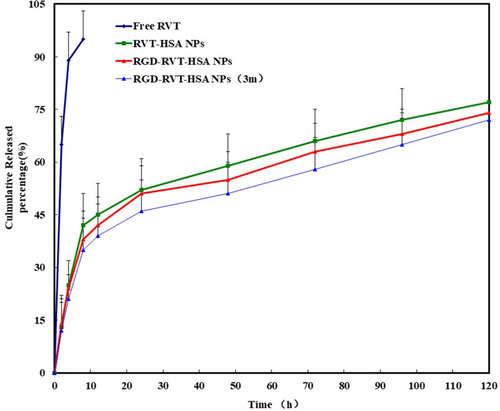
Figure 3 Confocal images of cellular uptake of blank NPs (A), free RVT (B), RVT-HSA NPs (C), RGD-RVT-HSA NPs (D) by SKOV-3 cells. Incubation time was 2 hours. (E) Fluorescence intensity of four groups. ap < 0.05, compared with blank NPs; bp < 0.05, compared with free RVT; cp < 0.05, compared with RVT-HSA NPs.
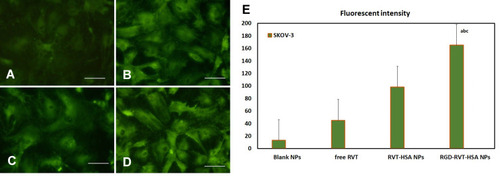
Figure 4 Effect of different RVT formulations on cell death in SKOV3 cancer cells. Assessment of cell viability of SKOV3 cells treated with free RVT, RVT-HSA NPs and RGD-RVT-HSA NPs at RVT concentration of 0.5–75 µM for 15 min followed by 24 or 48 h incubations. ap < 0.05, compared with blank NPs; bp < 0.05, compared with free RVT; cp < 0.05, compared with RVT-HSA NPs.
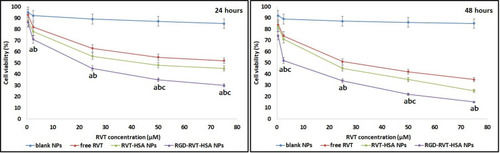
Table 2 The AUC0–12h of RVT in Plasma and Tissues After i.v. Administration of Injection and NPs to Mice (n=6)
Figure 5 The research results of tissue distribution and in vivo imaging studies. (A) free RVT, (B) RVT-HSA NPs, (C) RGD-RVT-HSA NPs and (D) Fluorescence images of three groups (at 12 h).
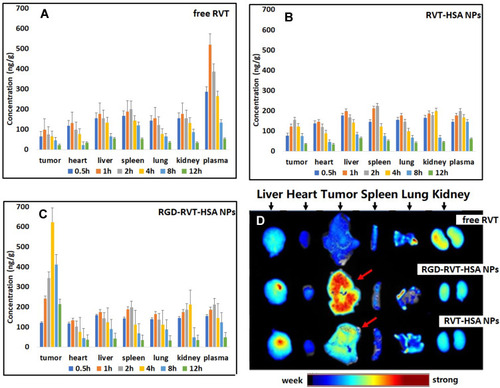
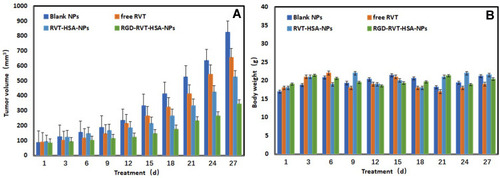
Figure 6 Changes of tumor volume (A) and body weight (B) in nude mice transplanted with SKOV3 cancer cells of blank NPs, free RVT, RVT-HSA NPs and RGD-RVT-HSA NPs.