Figures & data
Figure 1 Thymol suppresses proliferation, migration, invasion, and EMT in colorectal cancer (CRC) cells. (A) The chemical structure of thymol. (B) Antiproliferative effect of thymol on CRC HCT116 cells. (C) Antiproliferative effect of thymol on CRC Lovo cells. (D) Effects of thymol on the viability of human normal colon epithelial (FHC) cells. Cells were incubated with different concentrations (0, 10, 20, 40, 80, or 120 µg/mL) of thymol for 24, 48, or 72 h. The CCK-8 assay was used to assess cellular proliferation. DMSO (0.1%) was added as a control. *P < 0.05, **P < 0.01, ***P < 0.001 vs the control group. (E) Representative images from the colony formation assay showing colonies formed by HCT116 and Lovo cells. Cells were treated with thymol at different concentrations (0, 20, or 40 µg/mL). DMSO (0.1%) was added as a control. ***P < 0.001 vs the control group. (F) Transwell migration and invasion assays were performed in HCT116 and Lovo cells. Cells were treated with thymol at different concentrations (0, 20, or 40 μg/mL). DMSO (0.1%) was added as a control. Cell migration was assessed at 24 h and invasion at 48 h in both HCT116 and Lovo cells. After migration and invasion, the cells on the lower side of the filter were fixed, stained, and counted. All the images were obtained at a ×100 magnification. *P < 0.05, **P < 0.01, ***P < 0.001 vs the control group. (G) The expression of EMT-related proteins in thymol-treated CRC cells. E-cadherin, N-cadherin, Snail, vimentin, and β-actin were detected by Western blot in thymol-treated HCT116 and Lovo cells. Beta-actin was used as an internal control. All data are presented as mean ± SD of three independent experiments.
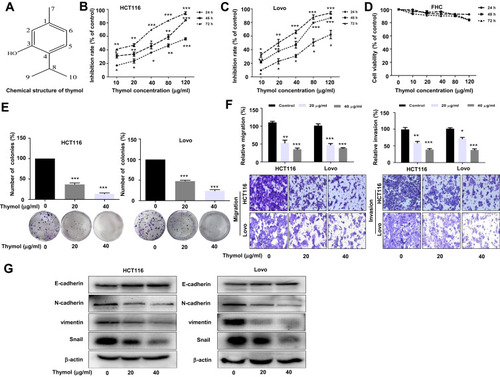
Figure 2 Thymol induces apoptosis and cell cycle arrest in colorectal cancer (CRC) cells. (A) Effects of thymol on the nuclear morphology of CRC cells. Cells were treated with thymol at different concentrations (0, 20, or 40 µg/mL). DMSO (0.1%) was added as a control. After 48 h, the cells were fixed and stained with Hoechst 33258. The morphology of the cancer cells was observed under a fluorescence microscope (×200). (B) Flow cytometric analysis of apoptosis in CRC cells. Thymol treatment promoted cell apoptosis in a dose-dependent manner. ***P < 0.001 vs the control group. (C) HCT116 and Lovo cells were treated with thymol at different concentrations (0, 20, or 40 µg/mL) for 48 h. DMSO (0.1%) was added as a control. Bcl-2, BAX, cleaved caspase-3, and cleaved PARP protein expression was evaluated by Western blot. (D) The mRNA levels of BAX and Bcl-2 were evaluated by RT-qPCR. GAPDH was used as an internal control. *P < 0.05, **P < 0.01, ***P < 0.001 vs the control group. (E) Cell cycle analysis by flow cytometry. Cells are treated with thymol at different concentrations (0, 20, or 40 µg/mL). DMSO (0.1%) was added as a control. Thymol treatment shortened the S phase and prolonged the G1 phase in HCT116 and Lovo cells. *P<0.05, **P<0.01, ***P<0.001 vs the control group. All data are presented as mean ± SD of three independent experiments.
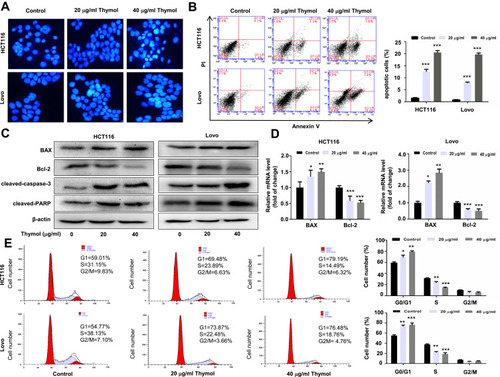
Figure 3 Thymol inhibits the growth of mouse xenograft colorectal cancer in vivo. Nude mice bearing colorectal cancer cell xenografts were treated with 2 mg/kg doxorubicin once a week and 75 or 150 mg/kg thymol every 2 days. Mice in the control group were treated with saline containing 1% DMSO. (A) Images of nude mice xenograft tumors after 30 days of treatment. (B) Tumor volume of the control, doxorubicin, and thymol treatment groups was measured and calculated once every 3 days. (C) Tumor weight in the control, doxorubicin, and thymol treatment groups. **P<0.01, ***P<0.001 vs the control group. (D) Representative histological examinations of the dissected tumors using hematoxylin and eosin (H&E) staining (upper panel) and Ki-67 antibody staining (lower panel) following thymol treatment. RT-qPCR (E) and Western blot (F) analyses were performed to evaluate the expression levels of the indicated mRNAs and proteins, respectively. *P<0.05, **P<0.01, ***P<0.001 vs the control group. The results are shown as mean ± SD from three independent experiments.
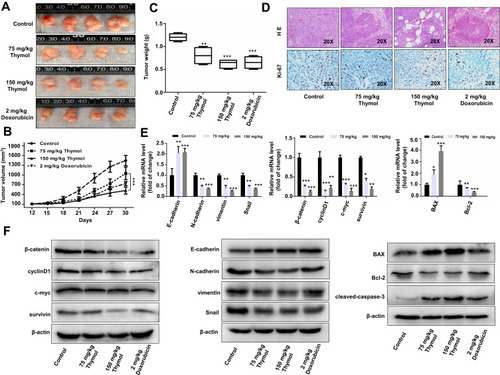
Figure 4 Thymol reduces colorectal cancer (CRC) lung metastasis. (A) Representative images of lungs with metastatic nodules (upper panel) and images of hematoxylin and eosin (H&E) staining of mouse lung tissues in the control and thymol-treated groups (lower panel). (B) Lung metastatic nodules were examined and quantified in the control and thymol-treated groups. **P<0.01 vs the control group. (C) The mRNA expression levels of E-cadherin, vimentin, Snail, and β-catenin were measured in lung tissues. *P < 0.05, **P<0.01, ***P<0.001 vs the control group. The results are shown as mean ± SD from three independent experiments. (D) Representative images of β-catenin, vimentin, and E-cadherin immunohistochemical staining in lung tissues.
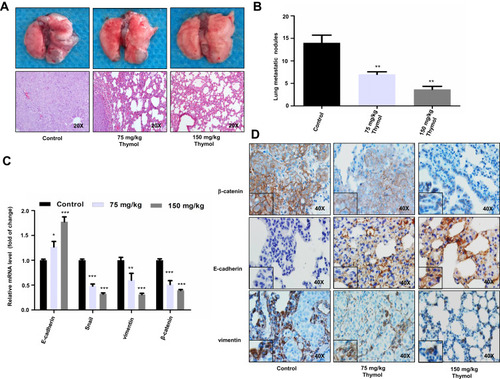
Figure 5 Thymol suppresses the activation of the Wnt/β-catenin signaling pathway in colorectal cancer (CRC) cells. HCT116 and Lovo cells were treated with different concentrations of thymol (0, 20, or 40 μg/mL) for 48 h. DMSO (0.1%) was added as a control. Cell total RNA and proteins were extracted. (A) RT-qPCR was performed to analyze the mRNA expression of β-catenin, c-Myc, cyclin D1, and survivin following thymol treatment. GAPDH was used as an internal control. *P<0.05, **P<0.01, ***P<0.001 vs the control group. (B) Western blotting analysis of β-catenin, c-myc, cyclin D1, and survivin protein expression following thymol treatment. Beta-actin was used as an internal control. All data are presented as mean ± SD of three independent experiments.
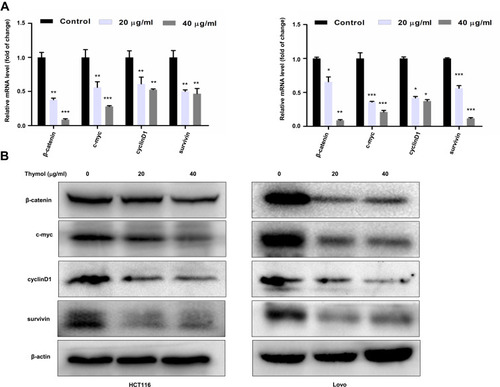
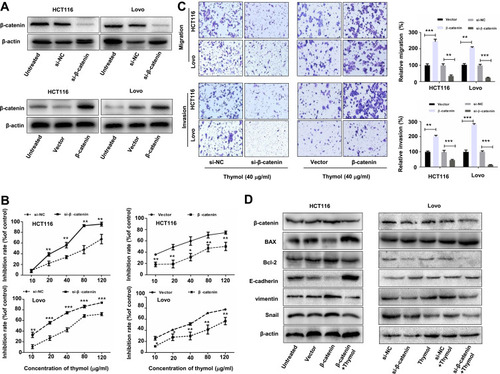
Figure 6 Thymol inhibits colorectal cancer (CRC) cell proliferation, migration, and invasion by suppressing Wnt/β-catenin signaling. HCT116 and Lovo cells were transfected with β-catenin siRNA (si-β-catenin)/negative control siRNA (si-NC) or the pcDNA3.1-β-catenin plasmid (β-catenin)/pcDNA3.1 (vector). (A) Western blot analysis of β-catenin expression in HCT116 and Lovo cells after transfection with β-catenin siRNA, pcDNA3.1-β-catenin, or the corresponding controls for 24 h. (B) At 24 h post transfection, the cells were exposed to different concentrations of thymol (0, 10, 20, 40, 80, or 120 µg/mL) and cell proliferation was quantified at 48 h. *P<0.05, **P<0.01, ***P<0.001 vs the control group. (C) At 24 h post transfection, cells were plated into the upper chamber of a transwell plate and treated with thymol (40 μg/mL). After 24 h of incubation, the migratory and invasive abilities were assessed. Cells were stained and imaged under a microscope (×100 magnification). **P<0.01, ***P<0.001 vs the control group. (D) At 24 h post transfection, cells were treated with thymol (40 μg/mL) for 48 h. The expression levels of β-catenin, BAX, Bcl-2, E-cadherin, vimentin, and Snail were measured by Western blotting, and normalized to β-actin expression. All data are presented as mean ± SD of three independent experiments.