Figures & data
Figure 1 Schematic diagram and TEM image of M-M GEM/ERL NPs. M-M GEM/ERL NPs was synthesized by conjugating MT1-MMP to the surface of GEM/ERL NPs and exhibited uniform spherical morphology.
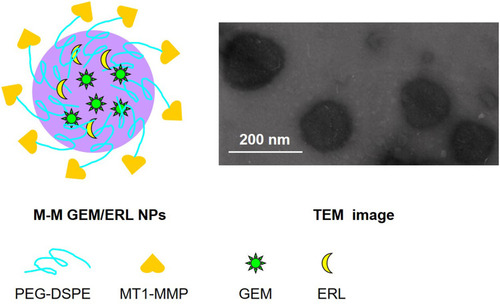
Table 1 Characterization of NPs
Figure 2 Plasma stability of NPs characterized by the changes of size (A), GEM EE (B), and ERL EE (C). During the 72 h of stability study, the particle sizes, GEM and ERL EEs of nanocarriers exhibited negligible changes. Data are presented as mean ± standard deviation (n=10).
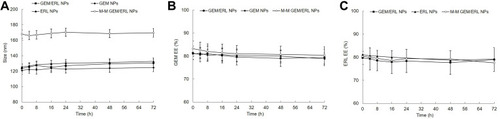
Figure 3 In vitro GEM (A) and ERL (B) release profiles. M-M GEM/ERL NPs showed slower release than GEM/ERL NPs. The drug release behaviors of single drug encapsulated GEM NPs and ERL NPs were similar with dual drugs loaded GEM/ERL NPs. Data are presented as mean ± standard deviation (n=10).
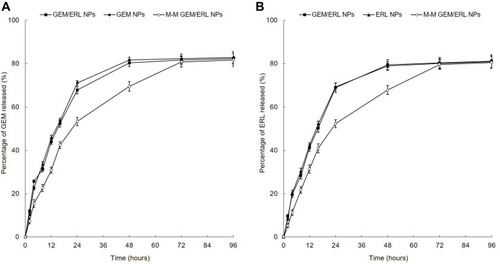
Figure 4 Cellular uptake efficiency of M-M GEM/ERL NPs and GEM/ERL NPs: cell images (A) and flow cytometry (B). *P < 0.05 compared with GEM/ERL NPs. MT1-MMP decorated M-M GEM/ERL NPs exhibited higher uptake ability (67.65 ± 2.87%) than GEM/ERL NPs (43.17 ± 2.37%). Data are presented as mean ± standard deviation (n=10).
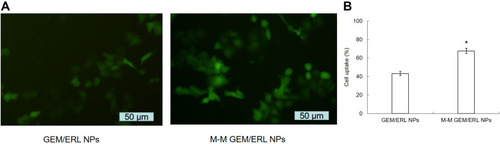
Figure 5 In vitro cell viabilities of NPs evaluated on two kinds of pancreatic tumor cell lines: PANC-1 (A) and AsPC-1 cells (B). M-M GEM/ERL NPs illustrated the most remarkable tumor cell inhibition ability on both cell lines. GEM/ERL NPs exhibited significantly higher cell inhibition efficiency than free GEM/ERL. Single drug-loaded GEM NPs and ERL NPs showed higher cell viability than their double drugs GEM/ERL NPs counterparts. Data are presented as mean ± standard deviation (n=10). *P < 0.05.
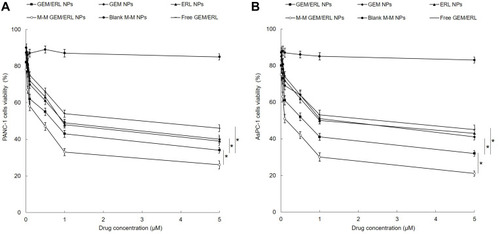
Table 2 Pharmacokinetics Data
Table 3 BUN, AST, and ALT Measurement
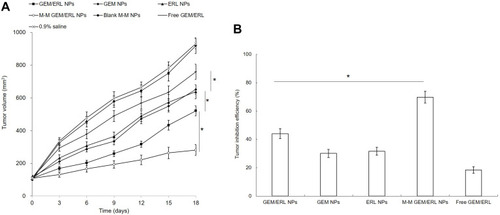
Figure 6 In vivo tumor growth curves (A) and tumor inhibition efficiencies (B). M-M GEM/ERL NPs group showed the most efficient tumor growth inhibition, and GEM/ERL NPs also suppressed tumor growth effectively compared to GEM NPs, ERL NPs and free GEM/ERL. Data are presented as mean ± standard deviation (n=10). *P < 0.05.