
Figures & data
Figure 1 Histological assessment of neonatal mice brain cortical sections. (A) control group; (B) propofol treatment group; (C) propofol+naringenin. Magnification 40x, Scale bar 100 μM.
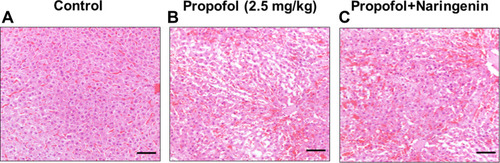
Table 1 Physiological Factors Assessment in Neonatal P7 Mice Exposed to Different Treatment Conditions
Figure 2 Activated caspase-3 (C-3A) IHC staining in brain cortex slices from neonatal mice. (A) control group; (B) propofol treatment group; (C) propofol+naringenin. (D) Quantitative expression of C-3A positive staining. *P<0.05 values versus control group; #P<0.05 values versus propofol group.
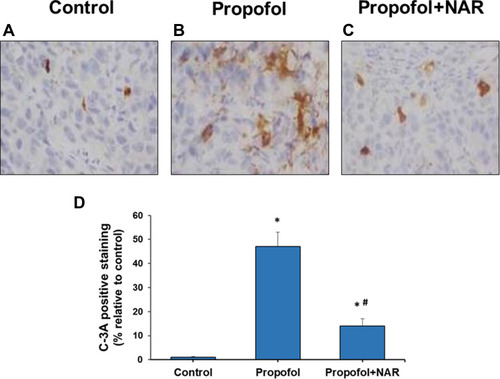
Figure 3 Apoptosis measurement by TUNEL staining of brain cortex slices from neonatal mice. (A) control group; (B) propofol treatment group; (C) propofol+naringenin. (D) Quantitative expression of TUNEL positive staining. *P<0.05 versus control group; #P<0.05 versus propofol group.
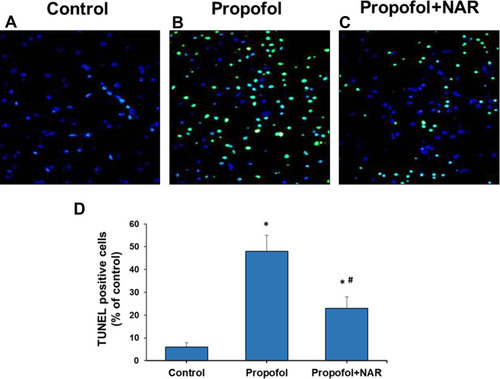
Figure 4 Gene and protein expression analysis for apoptosis and inflammation related genes. (A) qPCR was performed for Caspase-3, PARP, Bcl-xL, iNOS, COX-2, and NF-κB genes. Expression of genes was presented as fold change relative to control (one-fold). *P<0.05 versus control group; #P<0.05 versus propofol group. (B) Western blotting was performed for Bax, Caspase-3, PARP, and β-actin. NAR, naringenin. The arrows corresponding to the molecular weight of proteins are mentioned respectively.
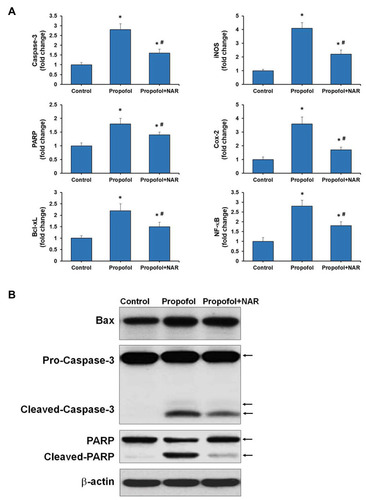
Figure 5 Neuronal nucleus (NeuN) expression analysis in cortical brain section of adult mice. (A) control group; (B) propofol treatment group; (C) propofol+naringenin. (D) Quantitative expression of NeuN expression. *P<0.05 versus control group; #P<0.05 versus propofol group.
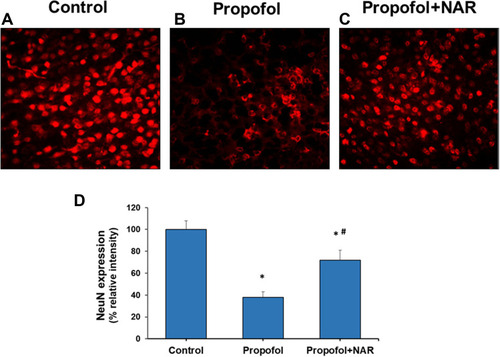
Figure 6 Assessment of learning behavior by measuring latency time. Latency time (s) was measured by calculating mice to find the hidden platform during day 1 to day 5 in the MWM test. *P<0.05 versus control group on test day; #P<0.05 versus propofol group on test day.
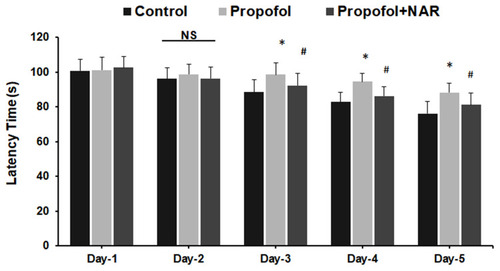
Table 2 Effect of Naringenin on Propofol Induced Behavioral Changes in Adult Mice