Figures & data
Figure 1 Effects of AGon elevated levels of serum creatinine induced by Hg.
P<0.05, ###
P<0.001.
Abbreviations: AG, Arabic gum; Hg, mercury; SEM, standard error of the mean; po, per oral.
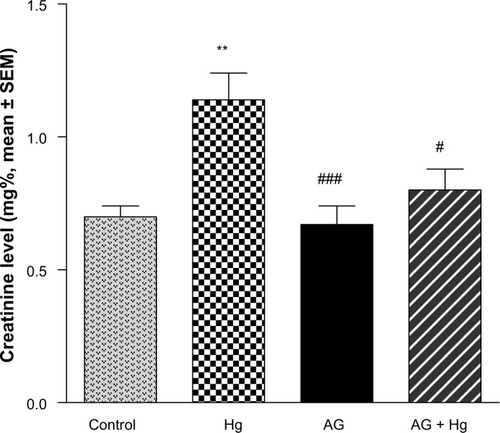
Figure 2 Effects of AG on elevated levels of BUN induced by Hg.
Abbreviations: AG, Arabic gum; BUN, blood urea nitrogen; Hg, mercury; SEM, standard error of the mean; po, per oral.
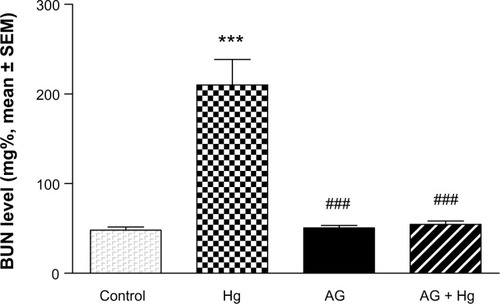
Figure 3 Effect of Hg, AG, and their combination on the levels of TBARS in rat renal tissues.
Abbreviations: AG, Arabic gum; Hg, mercury; SEM, standard error of the mean; TBARS, thiobarbituric acid reactive substances; po, per oral.
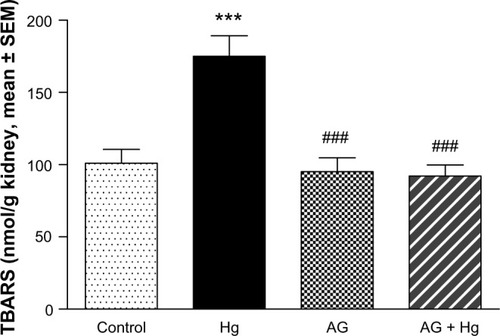
Figure 4 Effect of Hg, AG, and their combination on the levels of reduced GSH in rat renal tissues.
P<0.05.
Abbreviations: AG, Arabic gum; GSH, glutathione; Hg, mercury; SEM, standard error of the mean; po, per oral.
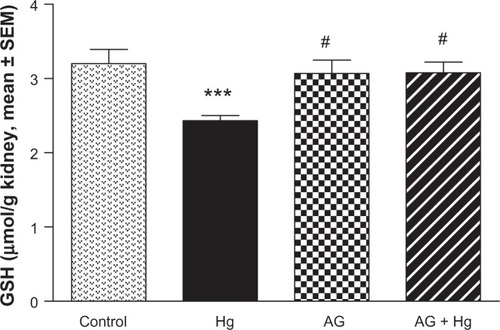
Figure 5 Effect of Hg, AG, and their combination on total NOx levels in rat renal tissues.
P<0.05, ##
P<0.01.
Abbreviations: AG, Arabic gum; Hg, mercury; NOx, nitrate/nitrite; SEM, standard error of the mean; po, per oral.
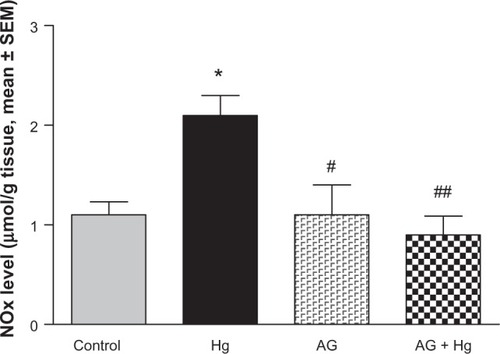
Figure 6 Effects of AGon changes in GSH-Px enzyme activities induced by Hg.
Abbreviations: AG, Arabic gum; GSH-Px, glutathione peroxidase; Hg, mercury; SEM, standard error of the mean; po, per oral.
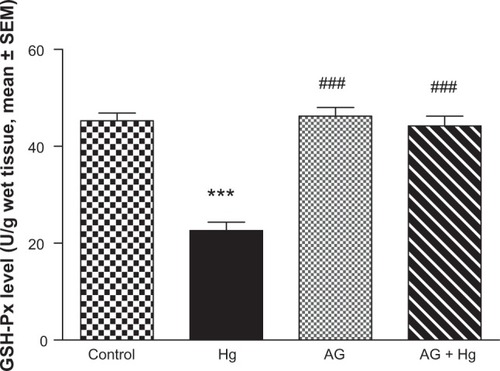
Figure 7 Effect of Hg, AG, and their combination on the catalase activity in rat renal tissues.
Abbreviations: AG, Arabic gum; Hg, mercury; SEM, standard error of the mean; po, per oral.
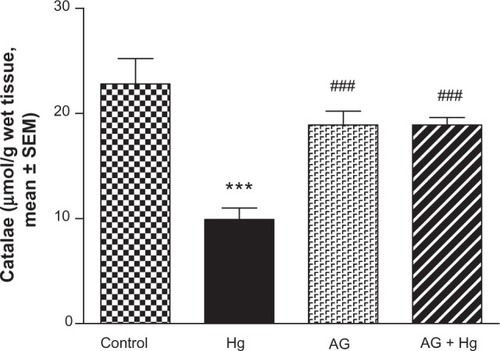
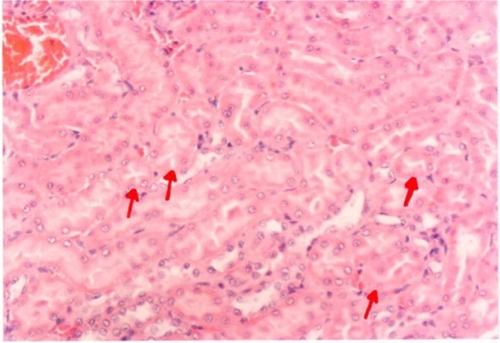
Figure 8 A photomicrograph of the renal cortex of a control rat. The red arrows showing parenchyma with normal glomeruli and tubules, ×200 magnification.
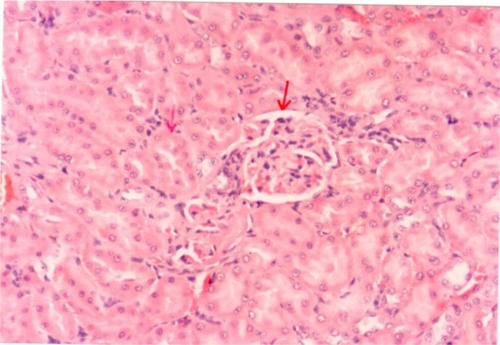
Figure 9 A photomicrograph of kidney of an Arabic gum-treated rat. The red arrows showing cortical tubules and peritubular capillaries with no pathogenic changes, ×200 magnification.
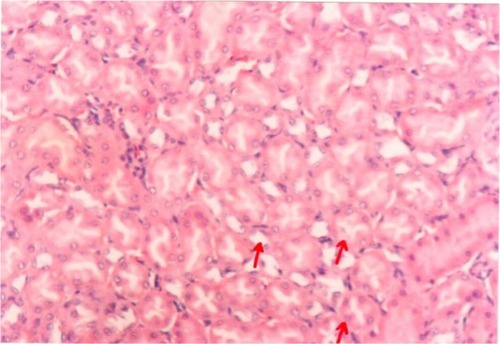
Figure 10 A photomicrograph of the kidney of an mercury-treated rat. The red arrows showing necrotic changes of the rental tubular cells and some tubles contain casts, ×400 magnification.
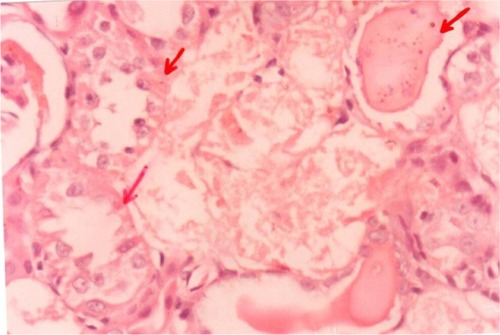
Figure 11 A photomicrograph of the kidney of an Arabic gum- and mercury-treated rat. The red arrows showing insignificant tubular epithelial changes in the form of cloudy swelling, ×200 magnification.