Figures & data
Figure 1 Transmission electron microscope images of ZnO nanoparticles (sized 10–100 nm).
Abbreviation: ZnO, zinc oxide.
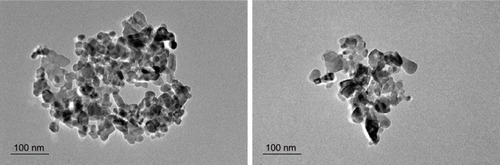
Table 1 PCR primers used for analysis of gene expression
Table 2 Regression equation, linear range, and LLOQ for the probe substrates used in incubations
Figure 2 Effects of ZnO nanoparticles on hematologic indices (A) and blood chemistry values (B).
Notes: *Significant difference from the control group (P<0.05); **significant difference from the control group (P<0.01).
Abbreviations: WBC, white blood cell; Lym, lymphocytes; Mon, monocytes; Gran, granulocytes; RBC, red blood cells; MCH, mean corpuscular hemoglobin; RDW, red cell distribution width; Hgb, hemoglobin; MCV, Mean corpuscular volume; MCHC, mean corpuscular hemoglobin concentration; ALT, alanine transaminase; AST, aspartate transaminase; ALP, alkaline phosphatase; CREA, creatinine; ALB, albumin; GLB, globulin; γ-GT, gamma-glutamyl transferase; TG, triglycerides; A/G, albumin to globulin ratio; HCT, hematocrit; TP, total protein; TC, total cholesterol; GLU, glucose.
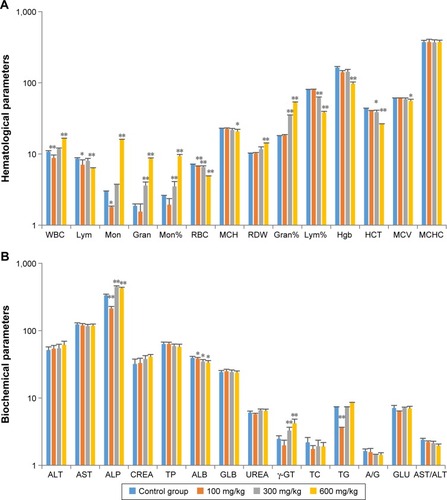
Figure 3 Effects of ZnO nanoparticles on concentration of cytokines.
Notes: *Significant difference from the control group (P<0.05); **significant difference from the control group (P<0.01).
Abbreviations: IL-6, interleukin-6; IFN-γ, interferon-γ; TNF-α, tumor necrosis factor alpha; ZnO, zinc oxide.
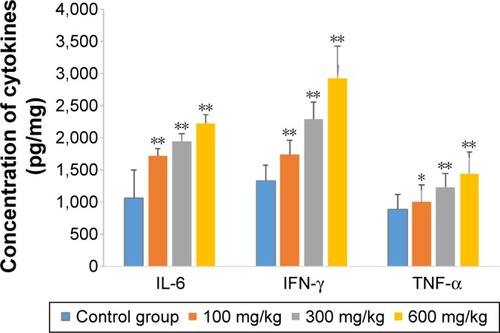
Figure 4 Effects of ZnO nanoparticles on the antioxidant ability of liver.
Notes: *Significant difference from the control group (P<0.05); **significant difference from the control group (P<0.01).
Abbreviations: CAT, catalase; SOD, superoxide dismutase; GSH-Px, glutathione peroxidase; MDA, malondialdehyde; ZnO, zinc oxide.
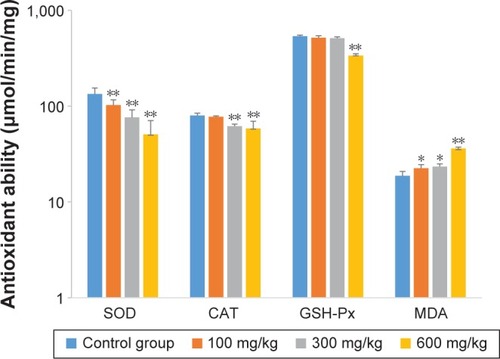
Figure 5 Effects of ZnO nanoparticles on mRNA expression of nuclear receptors and CYP enzymes.
Notes: *Significant difference from the control group (P<0.05); **significant difference from the control group (P<0.01).
Abbreviations: CAR, constitutive androstane receptor; PXR, pregnane X receptor; CYP, cytochrome; ZnO, zinc oxide.
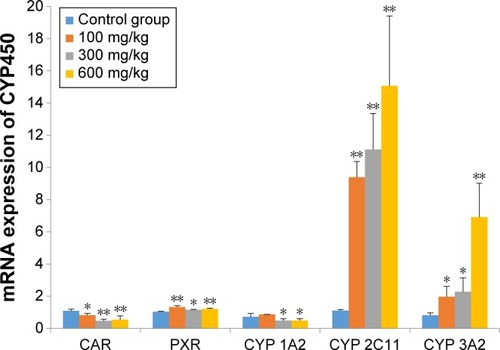
Figure 6 Effects of ZnO nanoparticles on the activities of liver (A) and intestinal (B) CYP enzymes.
Notes: **Significant difference from the control group (P<0.01).
Abbreviations: CYP, cytochrome; ZnO, zinc oxide.
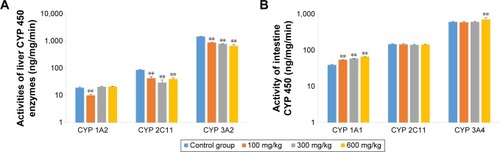
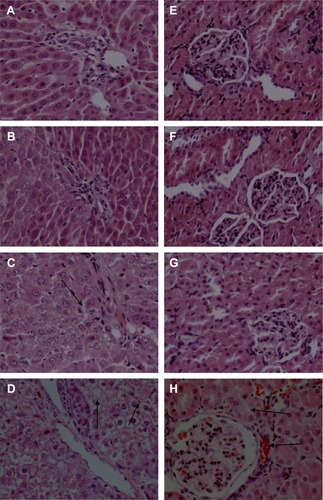
Figure 7 Effects of ZnO nanoparticles on the histopathologic appearance of liver and kidney tissues (HE ×400).
Notes: Liver: control group (A), 100 mg/kg (B), 300 mg/kg (C), and 600 mg/kg (D). Kidney: control group (E), 100 mg/kg (F), 300 mg/kg (G), and 600 mg/kg (H). (C) Liver cells are slightly swollen (arrows). (D) The intercellular space shows evidence of minor hemorrhage (arrows). (H) The glomerular and renal tubular epithelial cells have severe hemorrhage (arrows). Microscopic abnormalities were found in the group fed with ZnO nanoparticles at dose 300 mg/kg (C and G) and more severe abnormalities in the group fed at dose 600 mg/kg (D and H).
Abbreviations: ZnO, zinc oxide; HE, hematoxylin and eosin.