Figures & data
Figure 1 TEM of tested SiNPs.
Notes: Representative transmission electron micrograph of SiNPs. All particles were near-spherical in shape, and no stable aggregates were visible (scale bar =0.2 μm).
Abbreviations: TEM, transmission electron microscopy; SiNPs, silica nanoparticles.
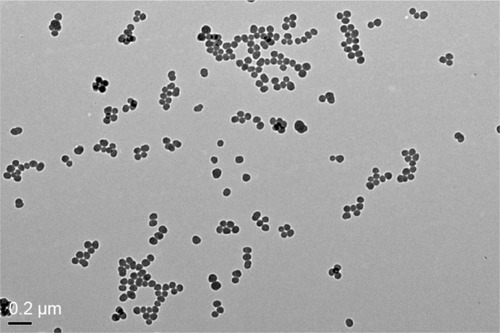
Figure 2 The declined cell viability of HUVECs induced by SiNPs, and restored by NAC.
Notes: (A) The cytotoxicity of NAC on HUVECs assessed by MTT assay. Cells were treated with NAC for 24 hours at various concentrations, which were 0.125, 0.25, 0.5, 1, 2, 4, 5, 8, and 10 mM, respectively. Control received culture medium only. Finally, 5 mM was chosen as the dose of NAC for the following study. (B) Cell viability of HUVECs measured by MTT assay. Cells were pretreated with 5 mM NAC for 2 hours followed by exposure of SiNPs (12.5, 25, 50, and 100 μg/mL, respectively) for either 24 or 48 hours. All values are mean ± SD of three identical experiments made in triplicate. *P<0.05 vs control and #P<0.05 for SiNPs vs SiNPs plus NAC.
Abbreviations: HUVECs, human umbilical vein endothelial cells; SiNPs, silica nanoparticles; NAC, N-acetylcysteine; MTT, 3-(4,5-dimethylthiazol-2-yl)-2,5-diphenyl-tetrazolium bromide; SD, standard deviation.
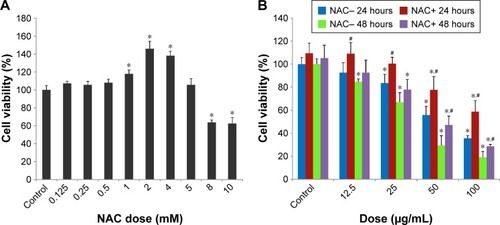
Table 1 LDH activity and silicon content after treatment with SiNPs and NAC
Figure 3 ROS production induced by SiNPs, which was attenuated by NAC.
Notes: (A) Fluorescence image of HUVECs under laser confocal microscope observed through DCFH-DA probe at a magnification of ×400. Cells were pretreated with 5 mM NAC for 2 hours, followed by 50 μg/mL SiNPs exposure for 24 hours. Control received culture medium only. (B) Quantification of the fluorescence by FCM using DCFH-DA and DHE probes for the detection of intracellular H2O2 and O2−, respectively. (C) MitoSOX™ via FCM for the determination of mitochondrial ROS. (D) The representative FCM scatter plots of intracellular H2O2, O2−, and mitochondrial ROS, respectively. Data are expressed as mean ± SD from three independent experiments. *P<0.05 vs control; #P<0.05 for SiNPs vs SiNPs + NAC.
Abbreviations: ROS, reactive oxygen species; SiNPs, silica nanoparticles; NAC, N-acetylcysteine; HUVECs, human umbilical vein endothelial cells; DCFH-DA, 2′,7′-dichlorofluorescein diacetate; FCM, flow cytometry; DHE, dihydroethidium; SD, standard deviation; MFI, mean fluorescence intensity.
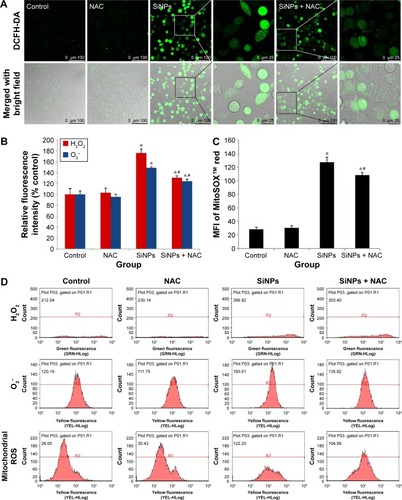
Figure 4 Oxidative injury induced by SiNPs and reduced by NAC.
Notes: After exposure to 50 μg/mL SiNPs for 24 hours plus pretreatment with 5 mM NAC for 2 hours, the (A) production of MDA, (B) GSH content, and (C) SOD activity were measured. Data are expressed as mean ± SD from three independent experiments. *P<0.05 vs control; #P<0.05 for SiNPs vs SiNPs + NAC.
Abbreviations: SiNPs, silica nanoparticles; NAC, N-acetylcysteine; MDA, malondialdehyde; GSH, glutathione; SOD, superoxide dismutase; SD, standard deviation; prot, protein.
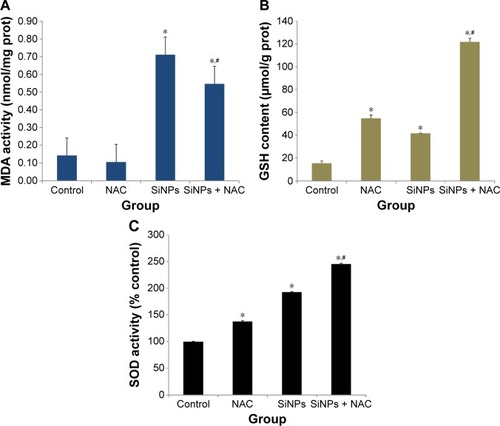
Figure 5 The activation of redox-mediated Nrf2 signaling pathway.
Notes: The mRNA expressions of Nrf2 and its key downstream genes, including SOD2, NQO1, TXN-1, TXNRD-1, GCLC, and hsp70, were measured through quantitative real-time PCR. Data are expressed as mean ± SD from three independent experiments. *P<0.05 vs control; #P<0.05 for SiNPs vs SiNPs + NAC.
Abbreviations: PCR, polymerase chain reaction; SD, standard deviation; SiNPs, silica nanoparticles; NAC, N-acetylcysteine.
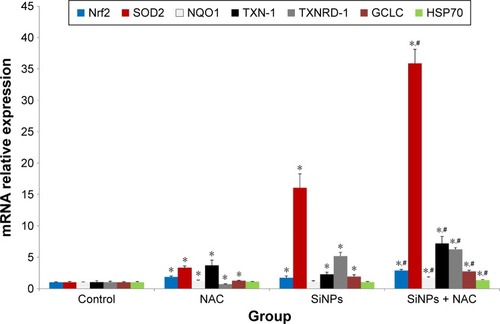
Figure 6 Apoptosis promoted by SiNPs, and the prevention by NAC.
Notes: (A) AO/EB staining and flow cytometry using (B) Annexin V-FITC double-stain were used to detect the apoptosis of HUVECs after treatment with 50 μg/mL SiNPs for 24 hours plus NAC pretreatment (5 mM, 2 hours). Scale bar =50 μm, with the magnification of ×200. Data are expressed as mean ± SD from three independent experiments. *P<0.05 vs control; #P<0.05 for SiNPs vs SiNPs + NAC.
Abbreviations: SiNPs, silica nanoparticles; NAC, N-acetylcysteine; AO, acridine orange; EB, ethidium bromide; HUVECs, human umbilical vein endothelial cells; SD, standard deviation.
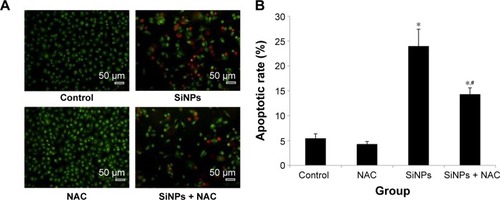
Figure 7 The loss of MMP induced by SiNPs and suppressed by NAC.
Notes: HUVECs were treated with 50 μg/mL SiNPs for 24 hours plus NAC pretreatment for 2 hours. The MMP was determined using the fluorescent probe, JC-1. (A) Confocal images of MMP at a magnification of ×1,200. (B) The JC-1 red/green fluorescence intensity ratio was used to express the changes of MMP, and the decreased ratio indicates decrease of MMP. Data are expressed as mean ± SD from three independent experiments. *P<0.05 vs control; #P<0.05 for SiNPs vs SiNPs + NAC.
Abbreviations: MMP, mitochondrial membrane potential; SiNPs, silica nanoparticles; NAC, N-acetylcysteine; HUVECs, human umbilical vein endothelial cells; SD, standard deviation; DAPI, 4′,6-diamidino-2-phenylindole.
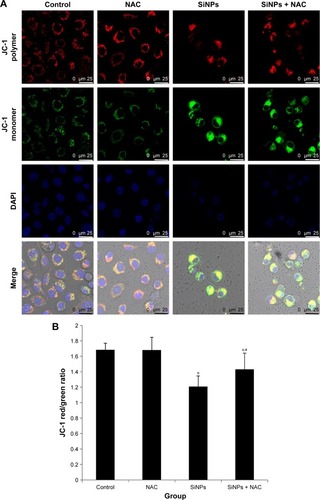
Figure 8 Induction of autophagy by SiNPs and reversed by NAC.
Notes: (A) Induction of autophagy in HUVECs by 50 μg/mL SiNPs observed under TEM. Control shows typical distribution of organelles within vascular endothelial cells. SiNPs-treated cell shows appearance of numerous perinuclear vacuoles typical of an autophagic cell. The white and black arrows indicate damaged mitochondrial and impaired lysosome, respectively, whereas the red arrow indicates a double-membranous phagophore developing into an autophagosome; (a and b) early autophagic vacuoles (AVi) containing membrane-bound cytoplasmic material, (c and d) and late autophagic vacuoles (AVs) with partially degraded cytoplasmic materials. LC3B expression was determined by immunofluorescence. Images demonstrate enhanced LC3-positive dots in HUVECs under 50 μg/mL SiNPs exposure, (B and C) while NAC pretreatment reversed the elevated LC3 level to nearly normal state. (D) Quantification of LC3 and p62 expressions was done by quantitative real-time PCR at mRNA level, and by Western blot at corresponding protein level. Data represented are the mean ± SD from three independent experiments. *P<0.05 vs control; #P<0.05 for SiNPs vs SiNPs + NAC.
Abbreviations: SiNPs, silica nanoparticles; NAC, N-acetylcysteine; HUVECs, human umbilical vein endothelial cells; TEM, transmission electron microscopy; PCR, polymerase chain reaction; SD, standard deviation; DAPI, 4′,6-diamidino-2-phenylindole.
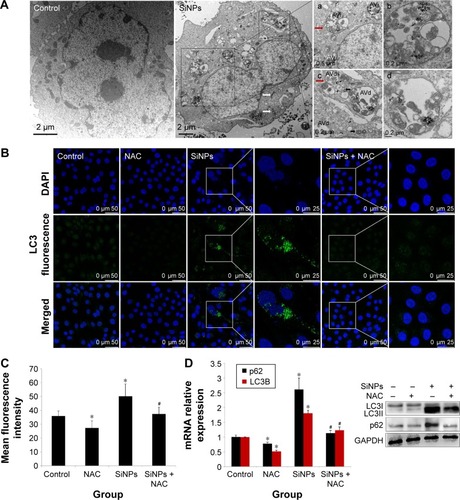
Figure 9 Regulation of MAPK/Bcl-2 and PI3K/Akt/mTOR signaling.
Notes: The expressions of ERK, p-ERK, p38 MAPK, p-p38 MAPK, JNK, p-JNK, PI3K, p-PI3K, Akt, p-Akt, mTOR, p-mTOR, bcl-2, and Bax were measured by Western blot assay after 24 hours of exposure to SiNPs plus NAC in HUVECs. (A) All blots shown are representative of three independent experiments. (B) Relative densitometric analysis of the protein bands was performed and presented. Data are expressed as the mean ± SD from three independent experiments. *P<0.05 vs control; #P<0.05 for SiNPs vs SiNPs + NAC.
Abbreviations: SiNPs, silica nanoparticles; NAC, N-acetylcysteine; HUVECs, human umbilical vein endothelial cells; SD, standard deviation.
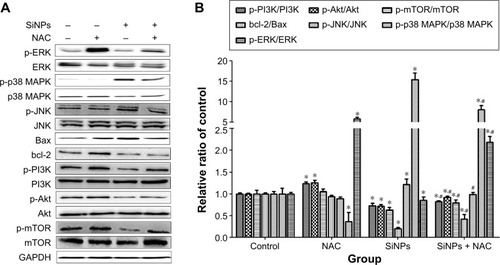
Figure 10 Schematic model of ROS-dependent MAPK/Bcl-2 and PI3K/Akt/mTOR signaling mediated cross talk between autophagy and apoptosis involved in endothelial injury triggered by SiNPs.
Abbreviations: ROS, reactive oxygen species; SiNPs, silica nanoparticles; NAC, N-acetylcysteine.
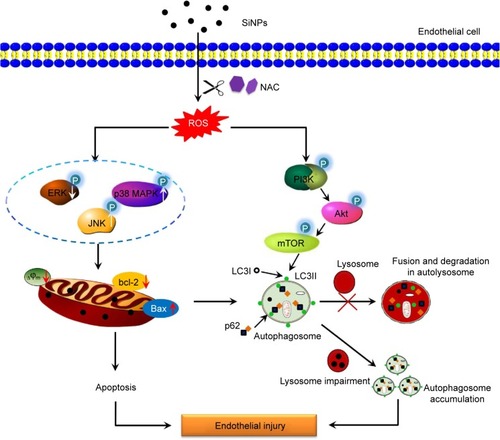
Figure S1 Lysosome impairment of HUVECs exposed to the SiNPs (50 μg/mL) for 24 hours.
Notes: LysoTracker Red (Beyotime) was used for the staining of lysosome in HUVECs. Compared with the control group, the significant decrease of fluorescence intensity in the SiNPs group indicated that SiNPs induced lysosome impairment in HUVECs.
Abbreviations: HUVECs, human umbilical vein endothelial cells; SiNPs, silica nanoparticles.
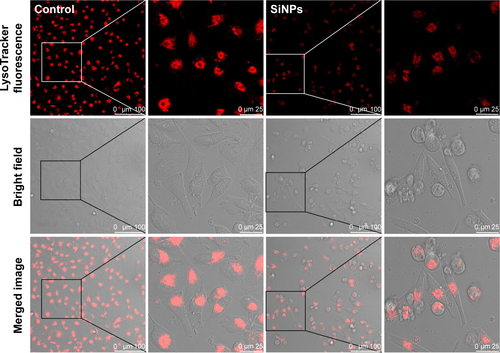
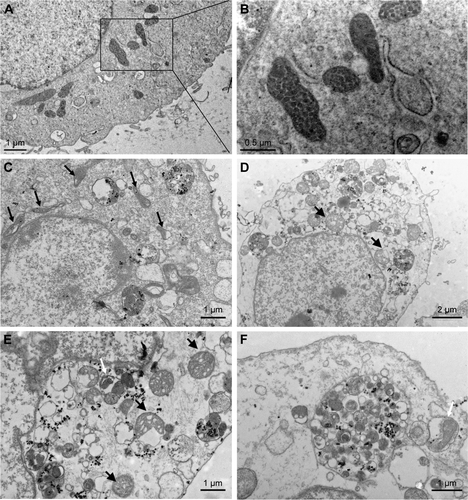
Figure S2 TEM images of HUVECs exposed to the SiNPs (50 μg/mL) for 24 hours.
Notes: (A) Control group. (B) The magnification of selected area of control showed evidently intact mitochondria. (C) The induction of mitochondrial swelling and cristae rupturing and disappearance after SiNPs exposure (black arrows), and also SiNPs deposition in mitochondria. (D and E) Severe mitochondrial swelling in SiNPs-treated endothelial cells (black arrows), and (E and F) autophagosome including cytoplasmic material, especially impaired mitochondria (white arrow).
Abbreviations: TEM, transmission electron microscopy; HUVECs, human umbilical vein endothelial cells; SiNPs, silica nanoparticles.