Figures & data
Figure 1 Schematic diagram of fabrication of CeO2 NPs using Olea europaea leaf extract.
Abbreviations: BARI, Barani Agricultural Research Institute; NPs, nanoparticles; SEM, scanning electron microscopy; O. europaea, Olea europaea.
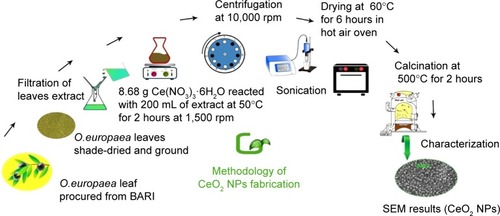
Figure 2 Hypothesized redox process of CeO2 NPs synthesis.
Abbreviation: NPs, nanoparticles.
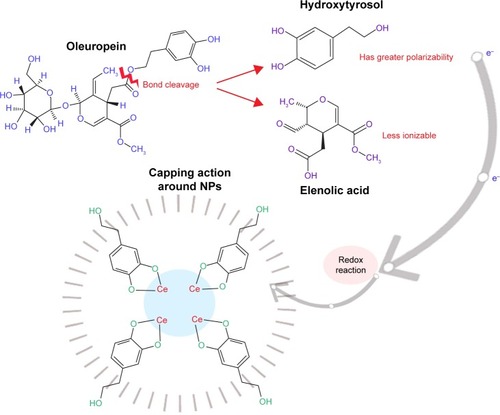
Figure 3 Biosynthesis of CeO2 NPs.
Abbreviations: NPs, nanoparticles; O. europaea, Olea europaea.
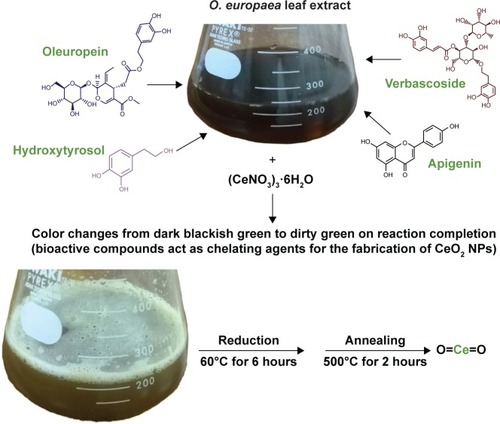
Figure 4 SEM images of green synthesized CeO2 NPs. (A) Magnification ×30,000; (B) Magnification ×50,000.
Abbreviations: NPs, nanoparticles; SEM, scanning electron microscopy; SEI, scanning electron-microscopy instrument; NUST, National University of Sciences and Technology.
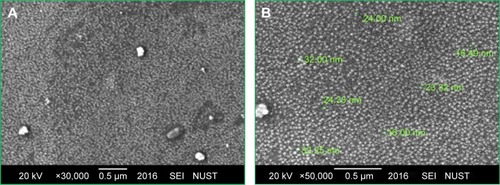
Figure 5 TEM micrographs of green synthesized CeO2 NPs.
Abbreviations: NPs, nanoparticles; TEM, transmission electron microscopy.
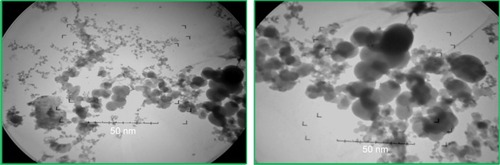
Figure 6 Typical XRD analysis of CeO2 NPs at room temperature.
Abbreviations: NPs, nanoparticles; XRD, X-ray diffraction.
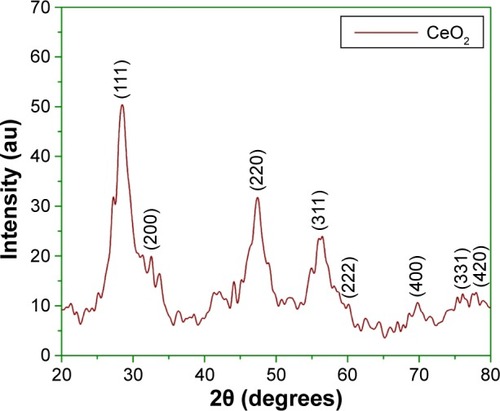
Figure 7 FTIR spectra of biosynthesized CeO2 NPs from Olea europaea leaf extract.
Notes: (a) Plant extract; (b) residue (as synthesized); (c) CeO2 NPs.
Abbreviations: FTIR, Fourier transform infrared; NPs, nanoparticles.
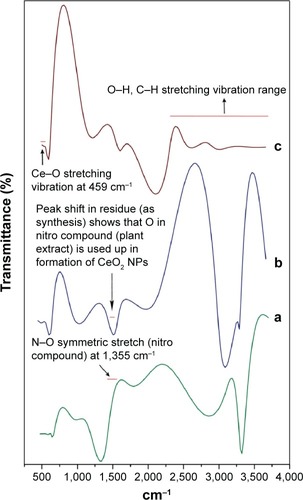
Figure 8 UV-Vis spectra of CeO2 NPs.
Abbreviations: NPs, nanoparticles; UV-Vis, ultraviolet-visible spectroscopy.
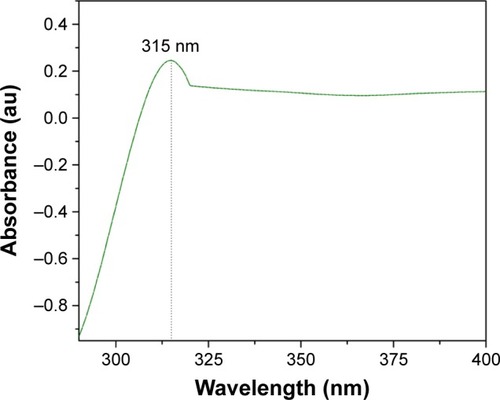
Figure 9 TGA curve of green synthesized CeO2 NPs.
Abbreviations: NPs, nanoparticles; TGA, thermal gravimetric analysis.
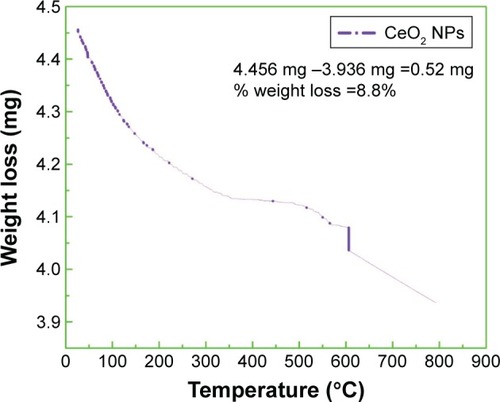
Figure 10 Antibacterial analysis of CeO2 NPs, plant extract, cefixime/roxithromycin (positive control), and deionized water (negative control), taking their mean values with ±SD.
Abbreviations: NPs, nanoparticles; SD, standard deviation.
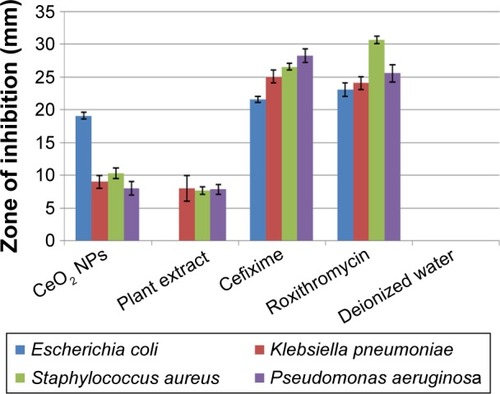
Figure 11 Schematic illustration of CeO2 NPs antibacterial activity.
Abbreviations: NPs, nanoparticles; ROS, reactive oxygen species.
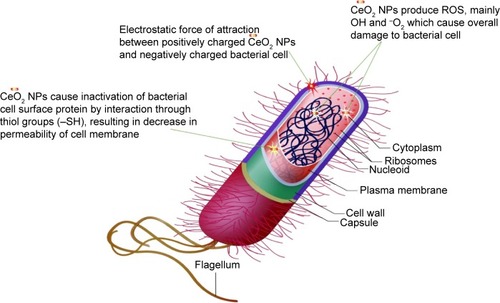
Figure 12 Antifungal analysis of CeO2 NPs, plant extract, clotrimazole (positive control), and deionized water (negative control), taking their mean values with ±SD.
Abbreviations: NPs, nanoparticles; SD, standard deviation.
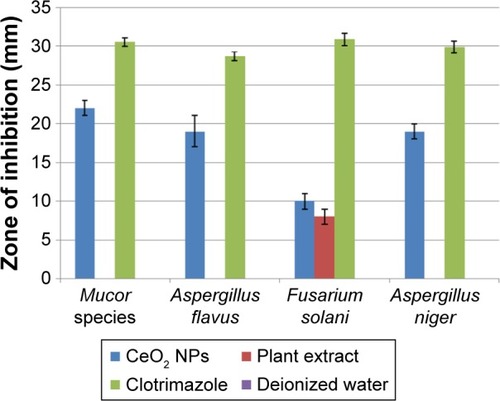
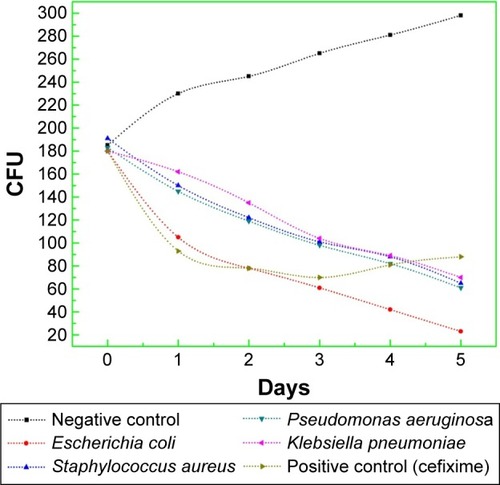
Figure 13 CFU counting assay of green synthesized CeO2 NPs against G+ve and G−ve bacterial strains.
Abbreviations: CFU, colony forming units; G+ve, Gram positive; G−ve, Gram negative; NPs, nanoparticles.