Figures & data
Figure 1 Characterization of ZnO NPs.
Notes: (A) A representative TEM micrograph of ZnO NPs. (B) UV-vis of ZnO NPs reveals an absorption peak at 360 nm. (C) Size distribution of ZnO NPs from DLS. ZnO NPs arê70 nm in diameter in solution. (D) Zeta potential of ZnO NPs is +5.8 mV.
Abbreviations: DLS, dynamic light scattering; NPs, nanoparticles; TEM, transmission electron microscopy; UV-vis, ultraviolet-visible.
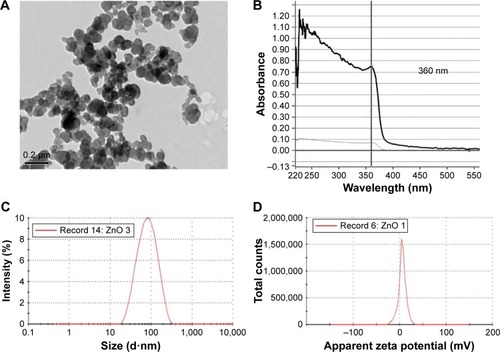
Figure 2 Cellular uptake of ZnO NPs and morphological changes in treated human MRC5 lung fibroblasts.
Notes: (A) EM micrograph of untreated MRC5 lung fibroblast. (B) EM micrograph of ZnO NP-treated MRC5 lung fibroblast. (C) LM micrograph of untreated MRC5 lung fibroblast. Magnification: ×100. (D) LM micrograph of 50 μg/mL ZnO NP-treated cells. Cells are shrunken, indicative of cell death. Magnification: ×100. (E) Confocal micrograph of untreated MRC5 cell. Magnification: ×200. (F) Confocal micrograph of cells treated with 25 μg/mL ZnO NPs, showing cell shrinkage (as indicated by arrow). Magnification: ×200.
Abbreviations: EM, electron microscope; NPs, nanoparticles; LM, light microscope.
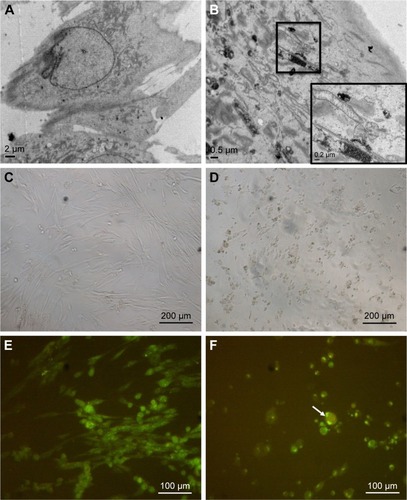
Figure 3 ZnO NP exposure caused decrease in cell survival and proliferation in MRC5 cells.
Notes: (A) LDH assay reveals early cytotoxicity of ZnO NPs on MRC5 cells. MRC5 cells release significant amount of LDH into the culture media, indicating cellular membrane disruption starting from a dose of 50 μg/mL. (B) AlamarBlue® assay shows a dose-dependent decrease in cell viability after ZnO NP treatment in MRC5 cells. (C) Flow cytometry (FACS) cell cycle analysis of MRC5 cells following ZnO NP exposure. Graphical representations of % of cells on the y-axis show a significant dose-dependent increase in cell death (sub-G1 phase) and decrease in cell proliferation (S + G2/M phase) when treated with ZnO NPs in MRC5 cells. (D) Detection of apoptotic cells in ZnO NP-treated MRC5 using Annexin V FITC/propidium iodide staining as analyzed by FACS. Error bars = SEM; *P<0.05; **P<0.01; ***P<0.001; ****P<0.0001.
Abbreviations: FACS, fluorescence-activated cell sorting; FITC, fluorescein isothiocyanate; LDH, lactate dehydrogenase; NPs, nanoparticles; SEM, standard error of the mean.
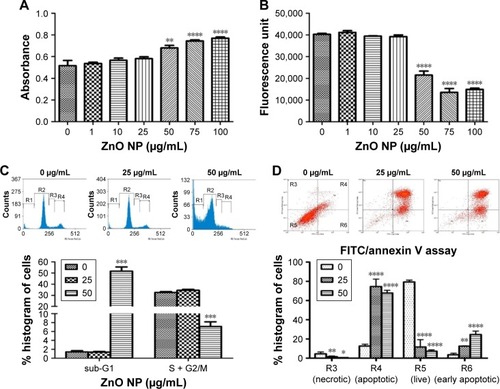
Figure 4 ZnO NP treatment causes a significant induction of intracellular ROS in MRC5 cells.
Notes: (A) ROS generation induced by 50 μg/mL ZnO NPs treatment as measured by FACS. There was an increase in DCFDA fluorescence intensity as indicated by a right shift in the treated cells as compared to the control cells. (B) Real time PCR analysis shows an increasing trend in the expression of ER stress-related genes in MRC5 lung fibroblasts following 16 h treatment at 25 and 50 μg/mL of ZnO NPs. Error bars = SEM; *P<0.05; ***P<0.001.
Abbreviations: DCFDA, 2′,7′-dichlorofluorescin diacetate; ER, endoplasmic reticulum; FACS, fluorescence-activated cell sorting; FITC, fluorescein isothiocyanate; NPs, nanoparticles; PCR, polymerase chain reaction; ROS, reactive oxygen species; SEM, standard error of the mean.
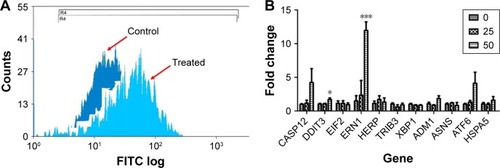
Figure 5 ZnO NPs induce genotoxicity in MRC5 cells.
Notes: (A) DNA oxidation product, 8-hydroxy-2′-deoxyguanosine (8-OHdG) was significantly increased in response to ZnO NP treatment, indicates DNA damage resulting from oxidative stress. (B) Comet assay of ZnO NP-treated MRC5 cells (bottom right inset) shows the formation of comet tail, an indicator of DNA damage, compared with control untreated cells (upper right inset; magnification: ×200). Error bars = SEM; *P<0.05; ****P<0.001.
Abbreviations: NPs, nanoparticles; SEM, standard error of the mean.
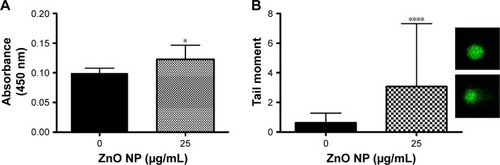
Figure 6 ZnO NPs adversely affect the viability of the fruit fly Drosophila melanogaster.
Notes: (A) EM imaging of the intestinal lumen control larva. (B) EM imaging on larval uptake of ZnO NPs at the intestinal lumen. Presence of ZnO NPs is indicated by the boxed area. (C) Treatment of wild-type flies with ZnO NPs results in a significant decrease in viability. Wild-type flies fed with different doses of ZnO NPs were removed after 5 days upon ingestion of ZnO NPs. Successfully, enclosed F1 adult flies were counted and their survival rate was presented after following up for 9 days. ****P<0.0001. (D) Treatment of wild-type flies with ZnO NPs results in a delay in development. Error bars = standard error of mean.
Abbreviations: EM, electron microscope; NPs, nanoparticles.
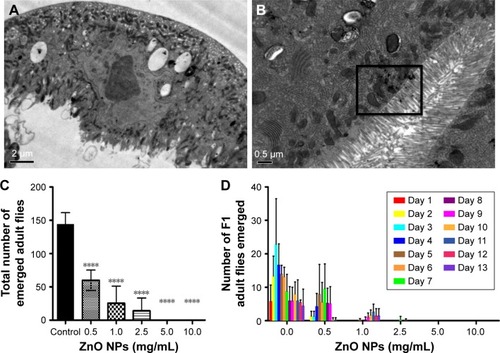
Figure 7 ZnO NPs induce ROS in a dose-dependent manner in the midgut of the Drosophila melanogaster larvae.
Notes: (A) DHE stain in control gut shows the basal level of ROS. (B, C) Treated gut cells show a gradual increase in DHE intensity. In particular, a dramatic increase in ROS is detected in gut cells treated with ZnO NPs at 0.5 mg/mL.
Abbreviations: DAPI, 4′,6-diamidino-2-phenylindole; DHE, dihydroethidium; ROS, reactive oxygen species; NPs, nanoparticles.
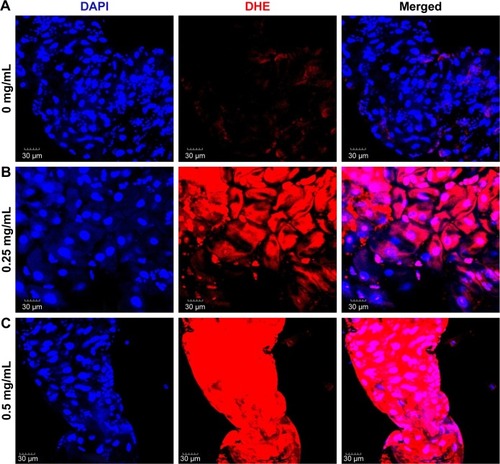
Figure 8 ROS induction is a direct cause of ZnO NP-mediated toxicity in Drosophila melanogaster.
Notes: (A) Schematic diagram showing the role of Nrf2 in the antioxidant defense mechanism. (B) Removal of one copy of Sod2 increases the lethality caused by ZnO NP treatment. (C) Removal of one copy of cncC (the Drosophila homolog of Nrf2) further enhanced reduction of viability caused by ZnO NP treatment. These observations suggest that excessive amounts of ROS induced by ZnO NPs adversely affect the viability of organisms in vivo. *P<0.05; **P<0.01.
Abbreviations: ROS, reactive oxygen species; NPs, nanoparticles.
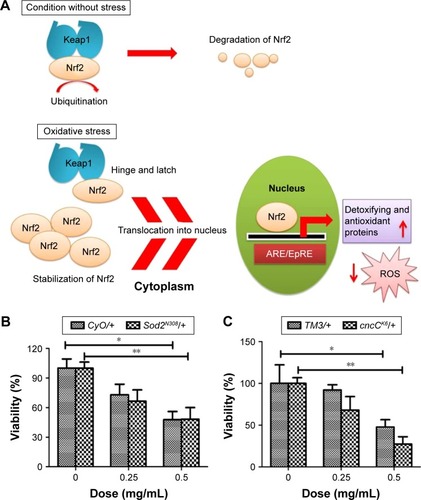
Figure S1 Effect of LA and GSH on ZnO NP-induced cytotoxicity in MRC5 cells.
Notes: (A) MRC5 cells were pretreated with 300 μM LA or (B) 3 mM of GSH for 24 h followed by 25 μg/mL ZnO NPs for 24 h. Pretreatment of antioxidants caused ~10% (8.317%±3.044% and 9.013%±3.327%, respectively) decrease in LDH compared to ZnO NPs alone.
Abbreviations: GSH, glutathione; LA, lipoic acid; LDH, lactate dehydrogenase; NPs, nanoparticles.
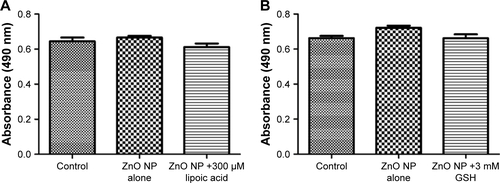
Figure S2 Comparison of the toxicity in Drosophila fed with two different ZnO NPs at 0.5 and 1 mg/mL.
Notes: The number of emerged adult flies exposed to ZnO NPs at (A) 0.5 mg/mL or (B) 1 mg/mL of ZnO NPs was recorded for 10 days. While administration of ~70 nm of ZnO NPs significantly reduced the viability as stated earlier on, oral administration of 50–80 nm ZnO NPs at both doses did not affect the viability greatly. Error bars = standard error of mean.
Abbreviations: BSA, bovine serum albumin; NPs, nanoparticles.
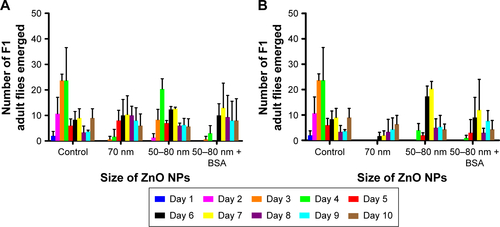
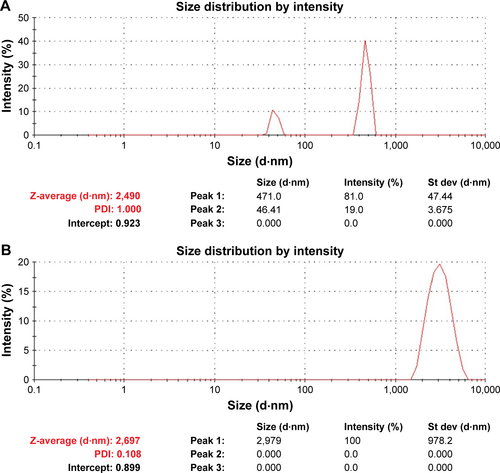
Figure S3 Particle size measurement of ZnO NPs in water by DLS technique.
Notes: (A) ZnO NPs used in the study by Alaraby et alCitation21 before sonication showed that majority of the NPs are >1 μm and (B) after sonication, the NPs became less polydispersive although majority of the NPs still agglomerated as large particles.
Abbreviations: DLS, dynamic light scattering; NPs, nanoparticles; PDI, polydispersity index; St dev, standard deviation.