Figures & data
Figure 1 Impact of cavitation on the fluorescence and cytotoxicity of Dox.
Notes: (A) Cavitation response of SSPs, Dox or a mixture of the solutions in the CTR upon exposure to ultrasound for 10 minutes. “Cavitation signal” is the root mean square (in Volts). (B) The fluorescence of a serial dilution of insonated Dox and SSPs in comparison with a positive control of non-ultrasound-treated Dox and a negative control of Dox denatured by heating and hydrogen peroxide exposure. (C) The viability of A549 cells after incubation with 4 μM Dox, or glucose and SSP samples diluted an equivalent amount measured using an MTS assay. Data represent the mean of N=3, and standard deviation is shown. ANOVA demonstrated no significant difference between any groups containing Dox.
Abbreviations: ANOVA, analysis of variance; Dox, doxorubicin; SSPs, sonosensitive particles; CTR, cavitation test rig; US, ultrasound; MTS, [3-(4,5-dimethylthiazol-2-yl)-5-(3-carboxymethoxyphenyl)-2-(4-sulfophenyl)-2H-tetrazolium.
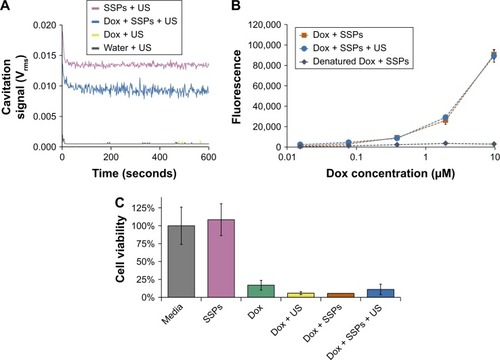
Figure 2 Assessment of whether cavitation alters the binding affinity of cetuximab.
Notes: (A) Cavitation response of SSPs, cetuximab, or a mixture of the solutions in the CTR. “Cavitation signal” is the root mean square (in Volts). A bridging ELISA to assess alteration to the binding capacity of cetuximab to its target, epidermal growth factor receptor, or the structure of the cetuximab using an HRP-labeled anti-cetuximab antibody where absorbance is directly correlated with binding in the ELISA. (B) ELISA absorbance of cetuximab at a concentration of 12.7 ng/mL compared to an equivalent concentration of control groups. (C) Absorbance as a function of cetuximab concentration for cetuximab + SSPs compared to an equivalent concentration range of cetuximab + SSPs + US of control groups. Data represent the mean of N=3, and standard deviation is shown. ANOVA demonstrated no significant difference between any groups containing cetuximab.
Abbreviations: ANOVA, analysis of variance; SSPs, sonosensitive particles; CTR, cavitation test rig; ELISA, enzyme-linked immunosorbent assay; US, ultrasound; HRP, horseradish peroxidase.
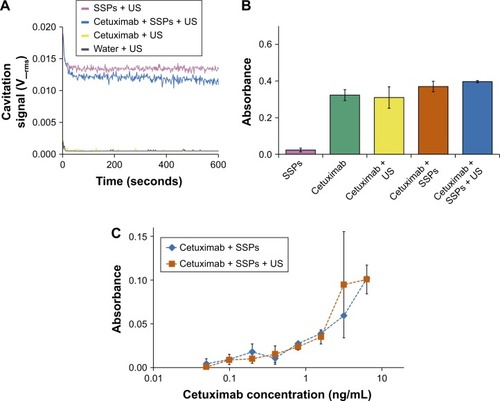
Figure 3 Impact of cavitation on the structural integrity and infectivity of Ad.
Notes: (A) Cavitation response of Ad, SSPs or a mixture of the solutions in the CTR. “Cavitation signal” is the root mean square (in Volts). (B) Picogreen assay to investigate capsid stability to cavitation exposure. Hatched bars (denoted as “−”) represent samples not exposed to SDS and heat treatment, and filled bars (denoted as “+”) represent samples deliberately subjected to capsid disruption using SDS and heat treatment. (C) Luminescence in A549 cells incubated with Ad expressing a luciferase transgene 24 hours after exposure of the Ad to buffer, SSPs, US or SSPs and US. Data represent the mean of N=3, and standard deviation is shown. ANOVA demonstrated no significant difference between any groups containing Ad.
Abbreviations: Ad, adenovirus; ANOVA, analysis of variance; SSPs, sonosensitive particles; CTR, cavitation test rig; SDS, sodium dodecyl sulfate; US, ultrasound.
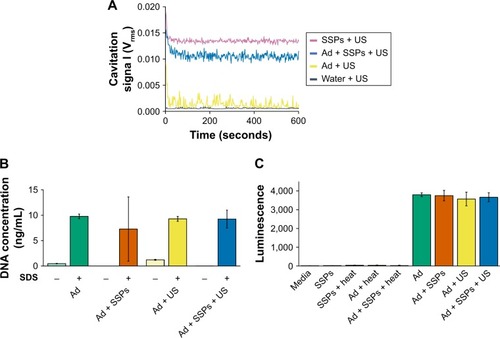
Figure 4 Impact of cavitation on infectivity of VV in cells incubated with the virus.
Notes: (A) Cavitation response of VV, SSPs or a mixture of the solutions in the CTR. “Cavitation signal” is the root mean square (in Volts). Following exposure in the CTR, a luciferase-expressing version of the VV was incubated with A549 cells for 24 hours before cells were processed, luciferin was added and luminescence measured. (B) Luminescence of cells incubated with 0.12 MOI VV or control treatments at an equivalent dilution, N=3. (C) Luminescence as a function of VV concentration, N=3. (D) As an alternative measure of infection and spread, A549 cells were infected with a non-luciferase-expressing oncolytic VV, and the number of plaques counted 3 days later. Data represent the mean of N=5. Standard deviation is shown.
Abbreviations: VV, vaccinia virus; SSPs, sonosensitive particles; CTR, cavitation test rig; MOI, multiplicity of infection; US, ultrasound; pfu, plaque-forming units.
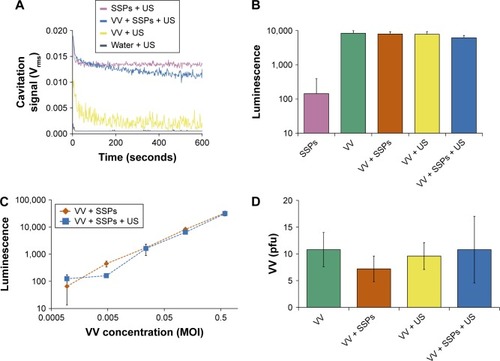
Figure S1 Schematic of the CTR.
Note: Sample was loaded into a 3 mL cuvette, and the cuvette placed in the holder to align it precisely with the transducers.
Abbreviation: CTR, cavitation test rig.
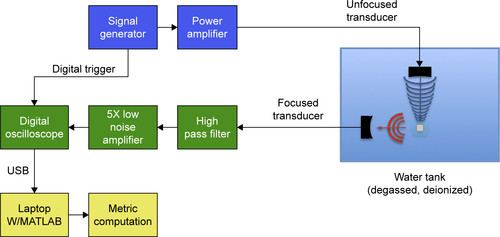
Figure S2 Characterization of CTR reproducibility.
Note: (A) Sustained cavitation activity over 10 minutes of sonication for 12 samples of SSPs. “Cavitation signal” is the root mean square (in Volts). (B) Broadband spectrum of SSP cavitation in the CTR from N=5 samples.
Abbreviations: CTR, cavitation test rig; SSPs, sonosensitive particles; SE, standard error.
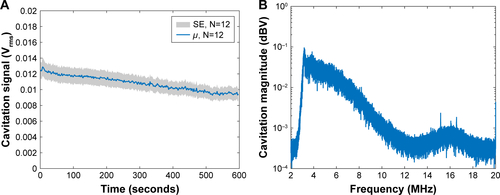
Figure S3 1H-NMR spectra of doxorubicin hydrochloride before and after exposure to ultrasound in the presence or absence of SSPs.
Note: Samples (0.4 mL each) were centrifuged to remove SSPs (14,000× g, 10 minutes). The supernatants were then filtered through 0.2 μm pore-size nylon membrane syringe filters, freeze-dried and redissolved in 600 μL of DMSO-d6. The structural assignment was made following Piorecka et al.Citation1
Abbreviations: SSPs, sonosensitive particles; Dox, doxorubicin; US, ultrasound.
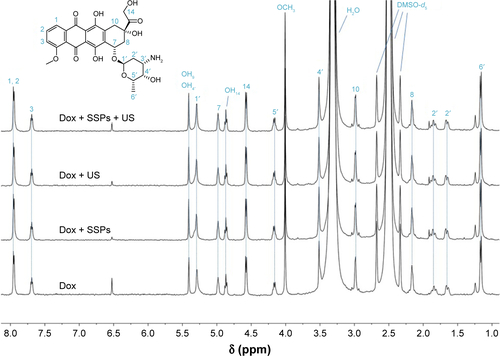
Figure S4 Demonstration that the cetuximab ELISA will not detect denatured cetuximab.
Notes: The EGFR-binding ability of a serial dilution of cetuximab was compared to that of a dilution series of heat-treated (100°C, 10 minutes) cetuximab. Data represent the mean of N=3, and standard deviation is shown.
Abbreviations: ELISA, enzyme-linked immunosorbent assay; EGFR, epidermal growth factor receptor.
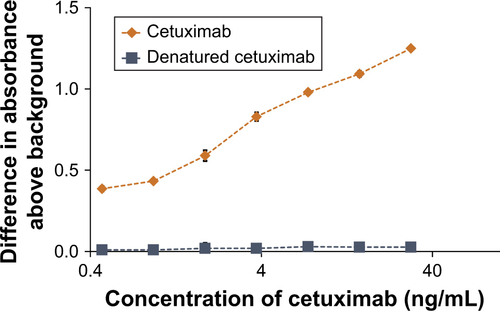
Figure S5 Impact of cavitation on the molecular weight of cetuximab analyzed by SDS-PAGE: (1) protein standard ladder; (2) untreated cetuximab; (3) cetuximab + SSPs; (4) cetuximab + US; (5) cetuximab + SSPs + US; and (6) heat-denatured cetuximab.
Notes: Samples 2–6 were diluted 3:1 in Laemmli sample buffer supplemented with 10% 2-mercaptoethanol, and heated to 95°C for 10 minutes. Sample 6 was pretreated by boiling at 100°C for 10 minutes prior to dilution in sample buffer. After boiling, 10 μL of sample (0.95 μg of antibody) was added per well into a 4%–20% polyacrylamide gel. The gel was run in Tris–glycine–SDS buffer at 160 V for 45 minutes.
Abbreviations: SSPs, sonosensitive particles; US, ultrasound; SDS, sodium dodecyl sulfate; MW, molecular weight; PAGE, polyacrylamide gel electrophoresis.
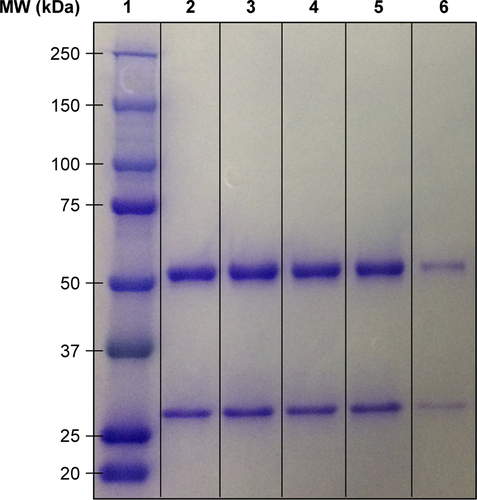
Figure S6 Luciferase expression in cells incubated with a serial dilution of insonated or non-insonated mixture of Ad and SSPs.
Notes: The trend between Ad concentration and transgene expression was no different between the Ad treatment groups. Data represent the mean of N=3, and standard deviation is shown.
Abbreviations: Ad, adenovirus; SSPs, sonosensitive particles; US, ultrasound; MOI, multiplicity of infection.
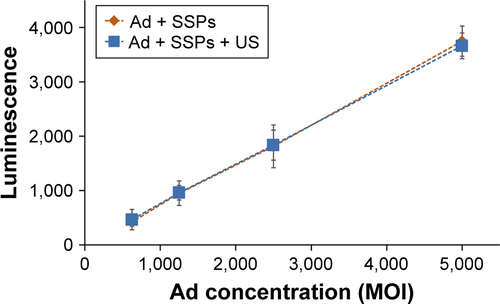
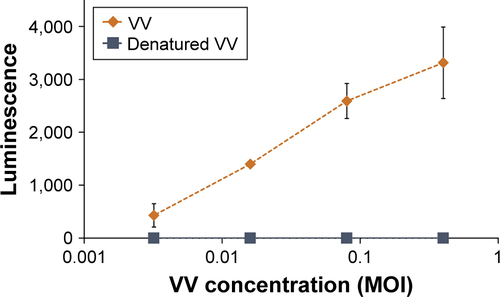
Figure S7 Demonstration that the luminescence of cells incubated with luciferase-expressing VV would not occur if the VV had been denatured.
Notes: A549 cells were incubated with a serial dilution of non-heated VV or heat-inactivated VV. Luciferin was added to the cells 24 hours later, and luminescence immediately measured. Data represent the mean of N=3, and standard deviation is shown.
Abbreviations: VV, vaccinia virus; MOI, multiplicity of infection.