Figures & data
Table 1 Parameters used for electrospun nanofibers
Figure 1 Characterization of nanoscaled and microscaled parallel topography. (A) The design of parallel microgrooved silicone membrane with groove width of 10 µm and groove depth of 3 µm. (B) SEM image of GT/PCL nanofibers showed unparallel and parallel patterns of electrospun nanofibers (500× and 1,000×, bar =100 µm). (C) The diameter distribution of unparallel nanofibers. (D) The diameter distribution of parallel nanofibers.
Abbreviations: GT, gelatin; PCL, poly(ε-caprolactone); SEM, scanning electron microscope.
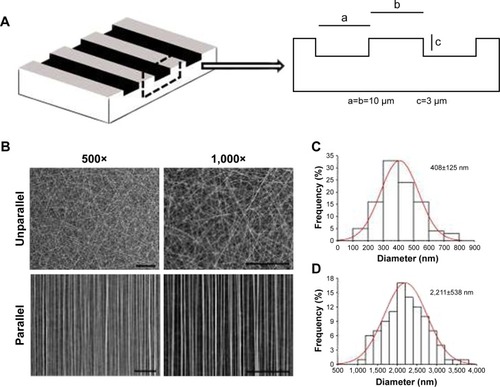
Table 2 Primers used in qPCR analysis
Figure 2 Gross view, histology, and gene expression of neotendon engineered with parallel PGA microfibers and neofat engineered with random PGA microfibers. (A) Setting of in vitro tissue culture with PGA microfibers, which were set on a U-shaped spring with constant strain to form parallel-aligned scaffold fibers. (B) The gross view of the scaffold. (C) The gross view of cell–scaffold construct at 2 hours post–cell seeding. (D) Gross view of neotendon engineered with parallel microfibers for 8 weeks. (E) Gross view of neofat engineered with random microfibers for 8 weeks. (F and H) H&E staining and polarizing light examination of neotendon engineered with parallel microfibers for 8 weeks (100×, bar =100 µm). (G and I) H&E staining and polarizing light examination of neofat engineered with random-patterned microfibers for 8 weeks (100×, bar =100 µm). (J) The gene expression of PPARγ and TNMD of the neo tissues post-8 weeks of culture. (K) Semi-quantification of the gene expression of PPARγ. (L) Semi-quantification of the gene expression of TNMD. In the pictures of J, K, and L, A, B, C, and D, respectively, represent neotendon and cells detached from parallel microfibers after seeding and grew on the culture dishes; and neofat and cells detached from unparallel microfibers after seeding and grew on the culture dishes.
Abbreviations: GAPDH, glyceraldehyde-3-phosphate dehydrogenase; H&E, hematoxylin and eosin; PGA, polyglycolic acid; PPARγ, peroxisome proliferator-activated receptor-γ; TNMD, tenomodulin.
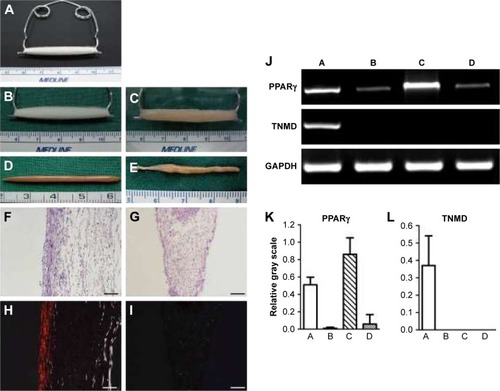
Figure 3 Cell morphology on nanoscaled and microscaled topographical surface. hASCs exhibited elongated cell shape on microgrooved surface (G) and spread cell shape on smooth membrane (S) when observed under phase contrast microscope (A) and fluorescence microscope with actin-staining (B) on day 3 postseeding (40× and 100×, bar =150 µm). Similarly, hASCs also exhibited elongated cell shape on parallel electrospun nanofibers (parallel) and spread cell shape on random electrospun nanofibers (unparallel) when observed under fluorescence microscope with actin staining (C) at various time points (100×, bar =100 µm).
Abbreviation: hASCs, human adipose-derived stem cells.
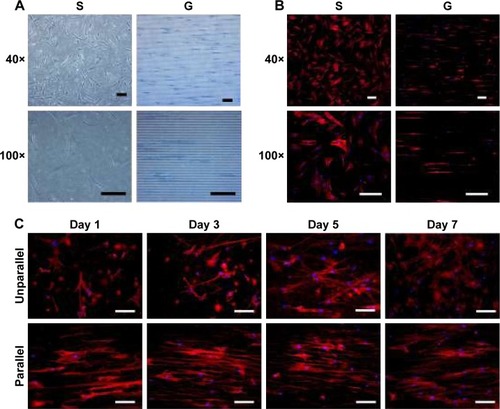
Figure 4 Cell proliferation on nanoscaled and microscaled topographical surface. Aligned topography restrained hASC proliferation on microscaled surface (A), but not on nanoscaled surface (B). **p<0.01; ***p<0.001.
Abbreviation: hASCs, human adipose-derived stem cells.
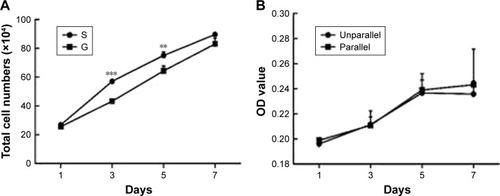
Figure 5 Quantitative analysis of cell morphology and orientation. Data distribution and quantification of cell area, cell body aspect, and cell body major axis angle on smooth surface (S) and microscaled grooved surface (G) on day 3 postseeding (A). Data distribution and quantification of cell area, cell body aspect, and cell body major axis angle on nanoscaled electrospun fibers of unparallel (U) and parallel (P) groups, respectively, on days 3 (B), 5 (C), and 7 (D). ***p<0.001.
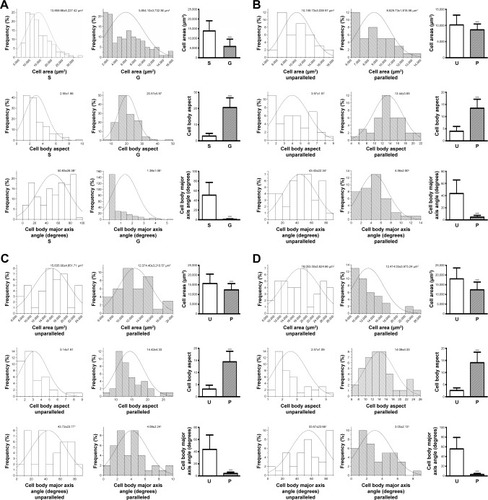
Figure 6 Tenogenic differentiation of hASCs on microscaled (A and B) and nanoscaled (C and D) aligned topographical surface on day 3 (A and C) and on day 7 (B and D), respectively. qPCR analysis showed significantly enhanced gene expression of tenogenic markers when cells were cultured on microscaled and nanoscaled aligned topographical surface. *p<0.05; **p<0.01; ***p<0.001.
Abbreviations: BGN, biglycan; COL 1, type I collagen; COL 3, type III collagen; COL 6, type VI collagen; DCN, decorin; FMOD, fibromodulin; hASCs, human adipose-derived stem cells; qPCR, quantitative PCR; SCX, scleraxis; TNC, tenascin-C; TNMD, tenomodulin.
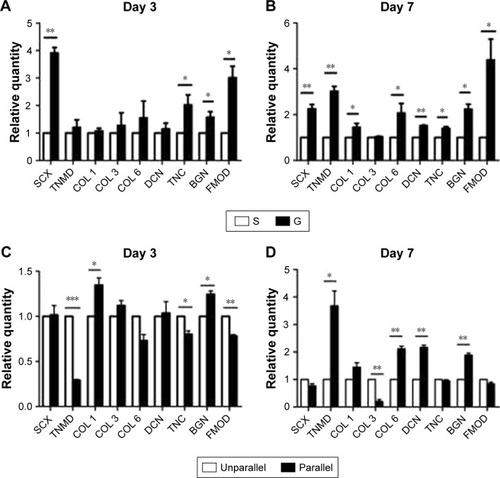
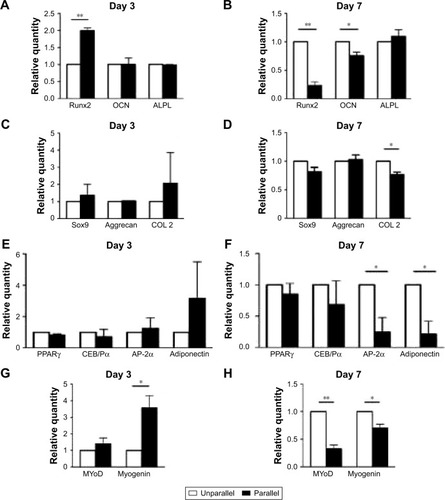
Figure 7 qPCR analysis of the effect of nanoscaled aligned topography on hASC differentiations toward the lineages of osteogenic (A and B), chondrogenic (C and D), adipogenic (E and F), and myogenic (G and H) on day 3 (A, C, E, G) and on day 7 (B, D, F, H). *p<0.05; **p<0.01.
Abbreviations: ALPL, alkaline phosphatase, liver/bone/kidney; AP-2α, adipocyte protein 2α; CEB/Pα, CCAAT/enhancer binding protein (C/EBP) α; COL2, type II collagen; hASCs, human adipose-derived stem cells; MAP2, microtubule-associated protein 2; MyoD, myoblast determination protein; OCN, osteocalcin; PPARγ, peroxisome proliferator-activated receptor-γ; qPCR, quantitative PCR; Runx2, Runt-related transcription factor 2; Sox9, SRY (sex determining region Y)-box 9.