Figures & data
Figure 1 Total HSPs generated at each temperature, in a.s.M. (A) When values are adjusted to 0.10, 0.16, 0.20, and 0.30 min−1. (B) When kb values are adjusted to 0.12, 0.23, 0.47, and 0.61 min−1. A higher heating temperature, a larger
, or a smaller kb do not necessarily give the maximum HSP synthesis, indicating both heating temperature, T, and heating duration time, τ, are crucial parameters to achieve optimal immune activation.
Abbreviations: HSPs, heat shock proteins; a.s.M, arbitrary scale molarity.
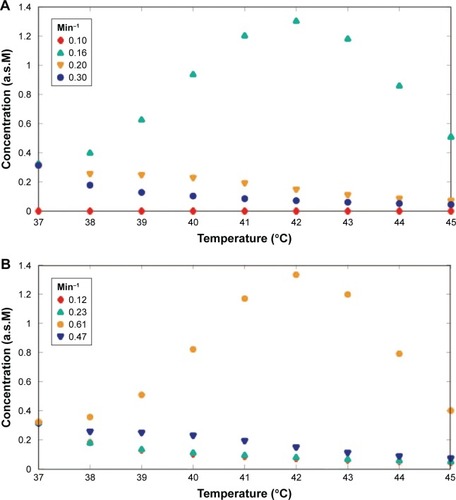
Figure 2 Total HSPs generated at each temperature. Comparison between the chosen kf and kb values. After each rate constant adjustment, a maximum HSP synthesis at 43°C can be achieved and HSP amount decreases, if the temperature is further raised. and kb = 0.62 min−1.
Abbreviations: HSPs, heat shock proteins; a.s.M, arbitrary scale molarity.
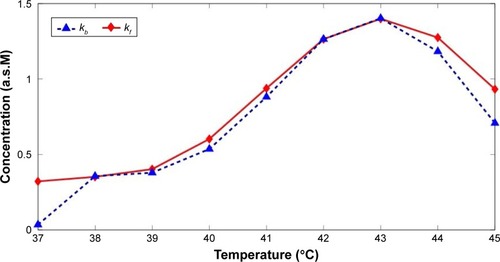
Table 1 List of [HSP]-cell death model parameters and values for optimized results
Figure 3 Maximum HSP synthesis is achieved at 43°C by using either the optimized kf or kb. Results for cytotoxic temperatures (≥43°C) are significantly different from those that are around the body temperature. (A) HSP generation rate, S(τ, T), for different heating temperatures using the optimized kb value. a.s.M/min. (B) Heating duration time and the accumulated HSP at different temperatures using the optimized kb value.
Abbreviations: HSPs, heat shock proteins; a.s.M, arbitrary scale molarity.
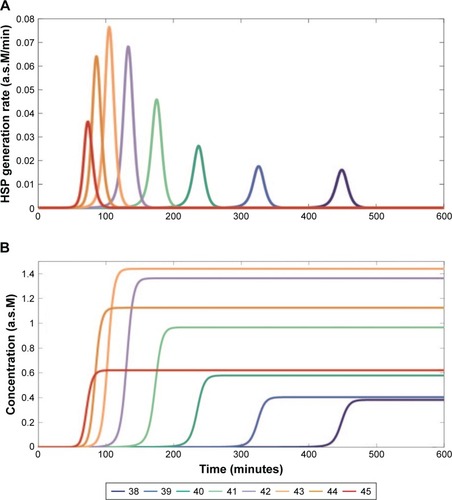
Figure 4 Dead cell fraction rate, , generated by cell death model using the optimized
value. Even though maximum HSP was obtained at 43°C, when heating temperature was raised, cells died at a faster rate and the final dead cell fraction increased along with the applied temperatures.
Abbreviation: HSP, heat shock protein.
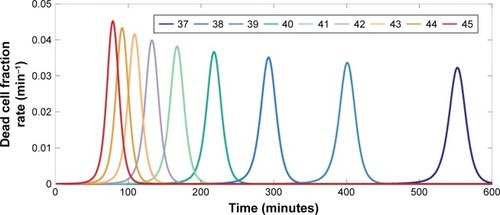
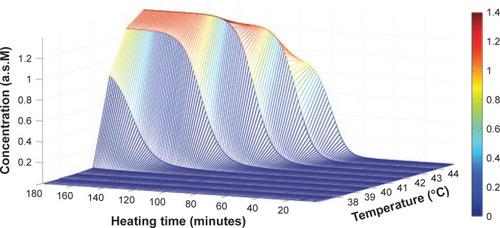
Figure 5 Heating duration time, τ, and the accumulated HSP at different temperatures, T, using the optimized value. A maximum final accumulated HSP was achieved at 43°C despite an enhanced HSP generation at higher temperatures when heat was applied initially. The dashed line is for the result obtained at body temperature 37°C, as a reference.
Abbreviations: HSP, heat shock protein; a.s.M, arbitrary scale molarity.
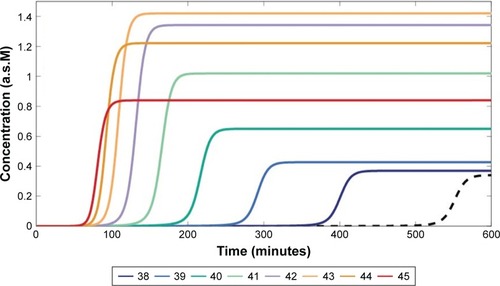
Figure 6 Maximum HSP synthesis with respect to heating temperature, T, and duration time, τ, using the optimized value. Duration time is approximately 100 min to achieve maximum HSP synthesis at 43°C. Maximum amount of HSP generated at the other temperatures is smaller than the amount achieved at 43°C, even a longer heating time is applied.
Abbreviations: HSP, heat shock protein; a.s.M, arbitrary scale molarity.