Figures & data
Figure 1 Timelines of experiments.
Abbreviations: PAT, passive avoidance test; MWM, Morris water maze; STZ, streptozotocin.
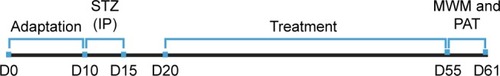
Figure 2 Characterization of QC-Fe3O4. FT-IR spectra for the (A) dextran-coated, (B) pure QC, and (C) QC-conjugated Fe3O4 nanoparticles (A). XRD pattern of the (A) dextran-coated and (B) QC-conjugated Fe3O4 nanoparticles (B). Scanning electron microscopy image of QC-conjugated Fe3O4 nanoparticles (C). Scanning electron microscope-EDX spectrum of QC-conjugated Fe3O4 nanoparticles (D).
Abbreviations: FT-IR, Fourier transform infrared; QC, quercetin; XRD, X-ray diffraction.
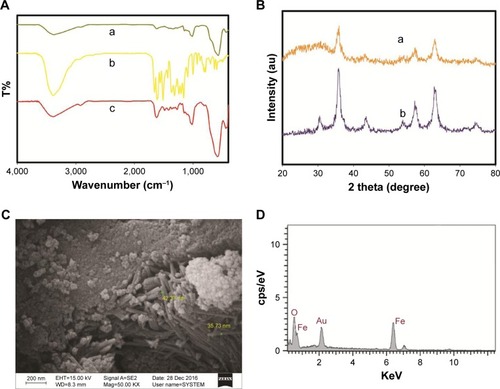
Table 1 Body weight of control, diabetic rats, and those treated with Fe3O4 NP, QC, and QC-Fe3O4 NPs at 20 and 10 days before treatment, the onset of treatment, 10, 20, 30, and 40 days after the beginning of treatment
Figure 3 Effect of treatment with Fe3O4 NPs, QC, QC-Fe3O4 NPs (35 days) on body weight (A) and blood glucose levels (B) in STZ-induced diabetic rats. Notes: Each value is represented as mean ± SEM of 7–8 animals per group. *P<0.05, **P<0.01, and ***P<0.0001 vs diabetic control group (two-way ANOVA).
Abbreviations: QC, quercetin; NP, nanoparticle; STZ, streptozotocin; NDC, non-diabetic control; DC, diabetic control; D+NP, diabetic treated with nanoparticle; D+QC, diabetic treated with quercetin; D+QCNP, diabetic treated with quercetin nanoparticle.
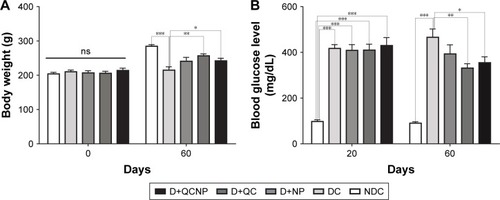
Figure 4 Effect of treatment with Fe3O4 NPs, QC, QC-Fe3O4 NPs (35 days) on the performance of spatial memory acquisition phase in Morris water maze test. Average escape latency during the training days (A), swim path traces from the final training day (B). Each value expressed as mean ± SEM of 7–8 animals per group. Statistical significance was determined using two-way ANOVA (followed by Tukey’s multiple comparison test) at **P<0.01 and ***P<0.0001 vs NDC group. #P<0.05, ##P<0.01, and @P<0.05 vs diabetic control group.
Abbreviations: QC, quercetin; NP, nanoparticle; NDC, non-diabetic control; DC, diabetic control; D+NP, diabetic treated with nanoparticle; D+QC, diabetic treated with quercetin; D+QCNP, diabetic treated with quercetin nanoparticle.
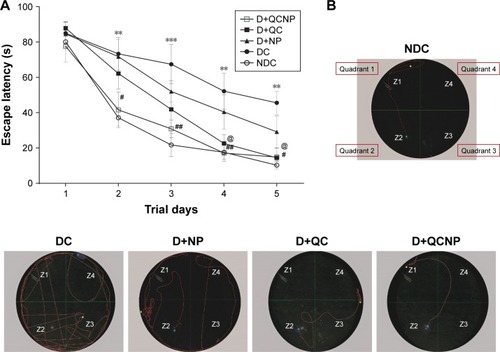
Figure 5 Comparison of swimming speed (A) and traveled swimming distance (B) during training trial days. Values are represented as mean ± SEM for 7–8 observations. Statistical significance was determined using two-way ANOVA (followed by Tukey’s multiple comparison test) at ***P<0.001 vs NDC group. ##P<0.01, ###P<0.001, @@P<0.01 and @@@P<0.001 vs diabetic control group.
Abbreviations: QC, quercetin; NP, nanoparticle; NDC, non-diabetic control; DC, diabetic control; D+NP, diabetic treated with nanoparticle; D+QC, diabetic treated with quercetin; D+QCNP, diabetic treated with quercetin nanoparticle.
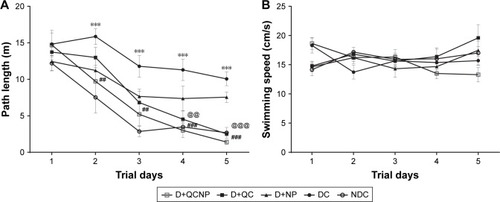
Figure 6 Effect of treatment with Fe3O4 NPs, QC, QC-Fe3O4 NPs (35 days) on water maze performance in the probe trial. Probe trial performance was measured by the time spent in the target zone (zone 2). Values are represented as mean ± SEM of 7–8 animals per group. *P<0.05 and ***P<0.0001 vs diabetic control group (two-way ANOVA followed by Tukey’s multiple comparison test).
Abbreviations: QC, quercetin; NP, nanoparticle; NDC, non-diabetic control; DC, diabetic control; D+NP, diabetic treated with nanoparticle; D+QC, diabetic treated with quercetin; D+QCNP, diabetic treated with quercetin nanoparticle.
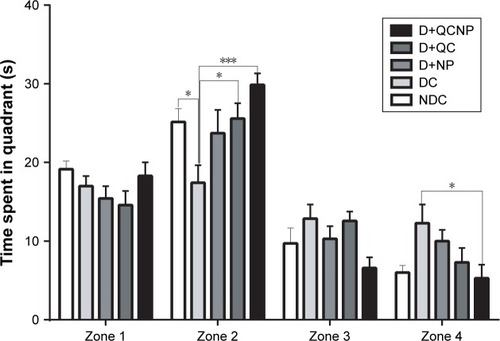
Figure 7 Effect of treatment with Fe3O4 NPs, QC, QC-Fe3O4 NPs (35 days) on passive avoidance performance. STL in the first acquisition trial (A) and STL in the retention test (B). Each value represents mean ± SEM of 7–8 animals. *P<0.05 vs diabetic control group (one-way ANOVA followed by Tukey’s test).
Abbreviations: QC, quercetin; NP, nanoparticle; NDC, non-diabetic control; DC, diabetic control; D+NP, diabetic treated with nanoparticle; D+QC, diabetic treated with quercetin; D+QCNP, diabetic treated with quercetin nanoparticle; STL, step-through latency.
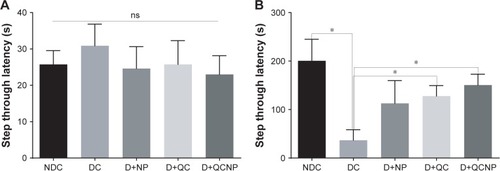
Figure 8 Effect of treatment with Fe3O4 NPs, QC, QC-Fe3O4 NPs (35 days) on the time spent in the dark compartment in the retention test (TDC). Each value represents mean ± SEM of 7–8 animals. *P<0.05 and **P<0.01 vs diabetic control group (one-way ANOVA followed by Tukey’s test).
Abbreviations: QC, quercetin; NP, nanoparticle; NDC, non-diabetic control; DC, diabetic control; D+NP, diabetic treated with nanoparticle; D+QC, diabetic treated with quercetin; D+QCNP, diabetic treated with quercetin nanoparticle.
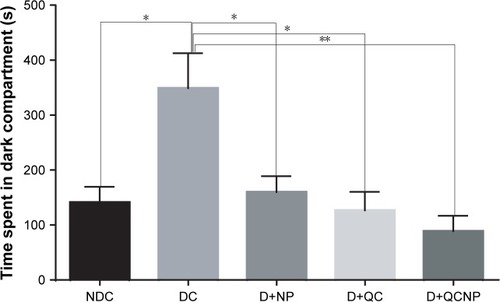
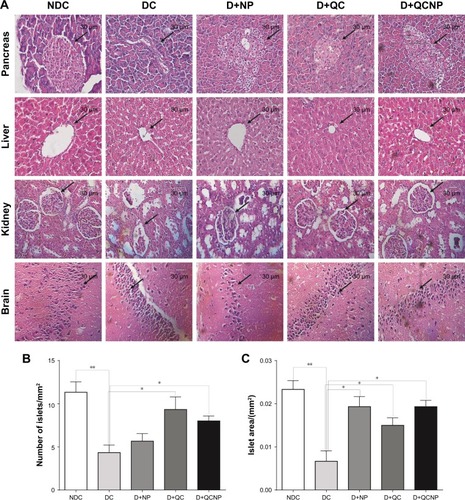
Figure 9 Photomicrographs of pancreas, liver, kidney, and brain sections after 35 days treatment with Fe3O4 NPs, QC, QC-Fe3O4 NPs (H&E staining, magnification 40×, scale bar: 30 µm) (A). The arrows show islets in pancreas, bile duct in liver, glomerular in kidney, and cell nuclear density and cytoplasm in hippocampus. The number of pancreatic islets/mmCitation2 (B) and the islet area (C) was measured from whole pancreas sections taken from rats. *P<0.05 and **P<0.01 vs diabetic control group (one-way ANOVA followed by Tukey’s test).
Abbreviations: QC, quercetin; NP, nanoparticle; H&E, hematoxylin & eosin; NDC, non-diabetic control; DC, diabetic control; D+NP, diabetic treated with nanoparticle; D+QC, diabetic treated with quercetin; D+QCNP, diabetic treated with quercetin nanoparticle.