Figures & data
Table 1 Antibacterial activities of the tested formulations (MIC)
Figure 1 The confocal microscope images of S. pneumonia ATCC 49619 (A) and S. pneumonia 16167 (B) stained by LIVE/DEAD after incubation with PEGylated Nano-BA12K, BA solution, and Penicillin G for 0.5, 1, 2, 4, 8, and 12 hours at 37°C.
Abbreviation: BA, bacitracin A.
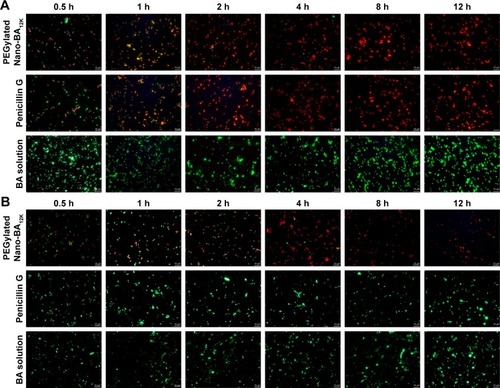
Figure 2 TEM micrographs of S. pneumonia ATCC 49619 treated with negative control (A), 0.5× MIC (B), 1× MIC (C), 2× MIC (D) of PEGylated Nano-BA12K, BA solution (E), and Penicillin G (F) for 2 hours.
Abbreviations: TEM, transmission electron microscopy; MIC, minimal inhibitory concentration; BA, bacitracin A.
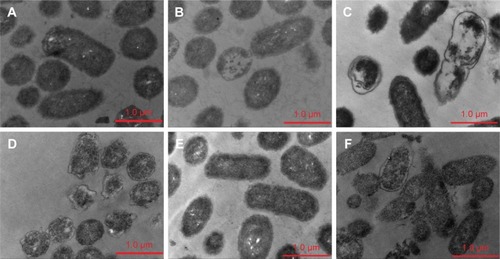
Figure 3 TEM micrographs of S. pneumonia 16167 treated with negative control (A), 0.5× MIC (B), 1× MIC (C), 2× MIC (D) of PEGylated Nano-BA12K, BA solution (E), and Penicillin G (F) for 2 hours.
Abbreviations: TEM, transmission electron microscopy; MIC, minimal inhibitory concentration; BA, bacitracin A.
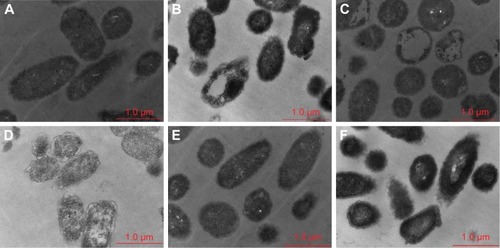
Table 2 Data of S. pneumonia affected by the tested formulations using AFM
Figure 4 AFM micrographs of S. pneumonia ATCC 49619 treated with negative control (A), PEGylated Nano-BA12K (B), and Penicillin G (C) for 2 hours; S. pneumonia 16167 treated with negative control (D), PEGylated Nano-BA12K (E), and Penicillin G (F) for 2 hours.
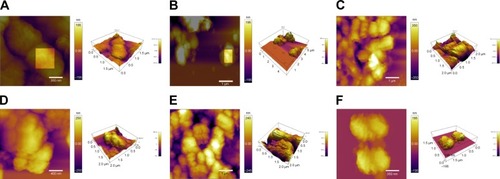
Figure 5 Effect of PEGylated Nano-BA12K on the PG content of S. pneumonia ATCC 49619 (A) and S. pneumonia 16167 (B). Three independent trails were performed and the mean value was used for the graphs. *P<0.05: different from the negative control, **P<0.01: significantly different from the negative control, −P>0.05: not significantly different from the negative control.
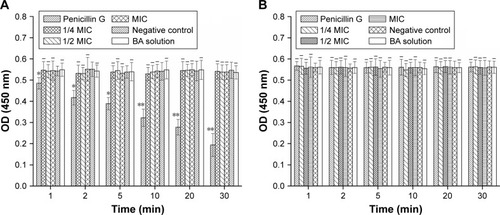
Figure 6 The surface tension variation of addition of BA-PEG-PLGA12K-PEG-BA and BA with various concentrations (n=6). Data are expressed as the mean ± SD (error bars).
Notes: a= the formation of “monomolecular” micelles; b= critical micelle concentration; c= the surface tension begins to decrease; and d= the surface tension remains constant.
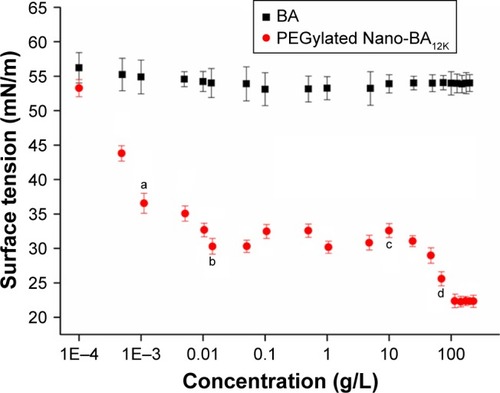
Figure 7 Cytoplasmic membrane potential variation of S. pneumonia ATCC 49619 (A) and S. pneumonia 16167 (B) treated with PEGylated Nano-BA12K at 1× MICs, as assessed by the release of the membrane potential-sensitive dye disC3-5. The fluorescence intensity was monitored at a λex =622 nm and λem =670 nm as a function of time. Effect of PEGylated Nano-BA12K on the cytoplasmic membrane permeability of S. pneumonia ATCC 49619 (C) and S. pneumonia 16167 (D). PEGylated Nano-BA12K-induced calcein release as a function of time. PEGylated Nano-BA12K was added to PTG/CL SUVs encapsulated with calcein (E). The graphs were derived from average values of three independent trials.
Abbreviations: BA, bacitracin A; CL, caidiolipin; PG, phosphatidylglycerol; MIC, minimal inhibitory concentration; SUV, small unilamellar vesicle.
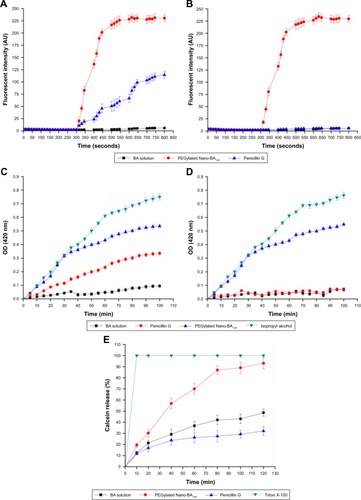
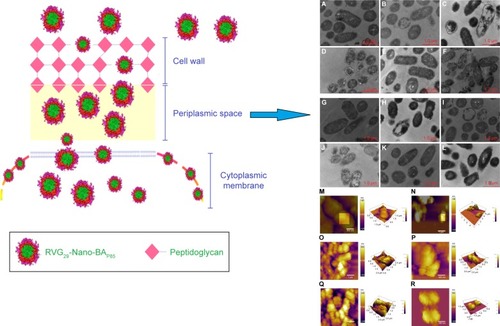
Figure 8 Schematic representation of the proposed action mode of PEGylated Nano-BA12K against S. pneumonia bacteria.
Notes: TEM micrographs of S. pneumonia ATCC 49619 treated with negative control (A), 0.5× MIC (B), 1× MIC (C), 2× MIC (D) of PEGylated Nano-BA12K, BA solution (E), and Penicillin G (F) for 2 hours. TEM micrographs of S. pneumonia 16167 treated with negative control (G), 0.5× MIC (H), 1× MIC (I), 2× MIC (J) of PEGylated Nano-BA12K, BA solution (K), and Penicillin G (L) for 2 hours. AFM micrographs of S. pneumonia ATCC 49619 treated with negative control (M), PEGylated Nano-BA12K (N), and Penicillin G (O) for 2 hours; S. pneumonia 16167 treated with negative control (P), PEGylated Nano-BA12K (Q), and Penicillin G (R) for 2 hours.
Abbreviations: TEM, transmission electron microscopy; MIC, minimal inhibitory concentration; BA, bacitracin A.