Figures & data
Figure 1 Characterization of test material CeO2NPs. (A) Scanning electron micrographs of CeO2; (B) transmission electron micrographs of CeO2; (C) size distribution histogram of CeO2NPs; (D) the results of XRD test.
Abbreviations: CeO2NPs, cerium oxide nanoparticles; XRD, X-ray powder diffractometry.
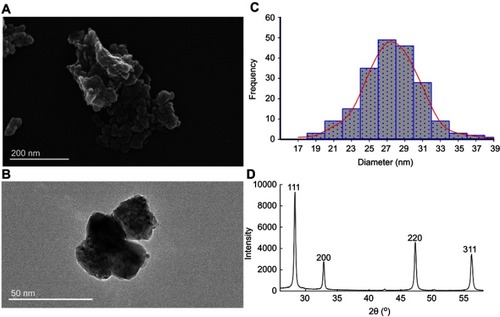
Table 1 Experimental design groups
Figure 2 Distribution of SAR of the culture medium inside a standard petri dish (35-mm) exposed to 1,800 MHz radiofrequency fields (power densities, 200.27 μW/cm2).
Abbreviation: SAR, specific absorption rate.
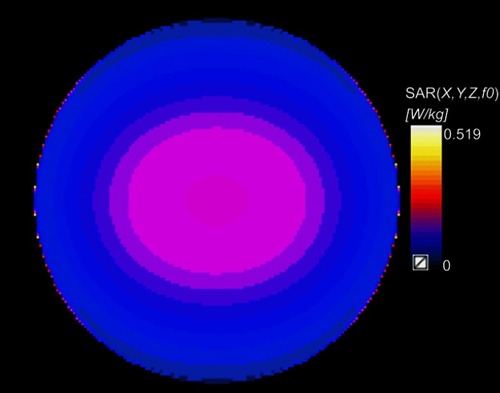
Table 2 Primer sequence for real-time PCR
Figure 3 Stain of HSD-3β on primary leydig cells (A, 20×; B, 40×).
Abbreviation: HSD-3β, 3β-Hydroxysteroid dehydrogenase.
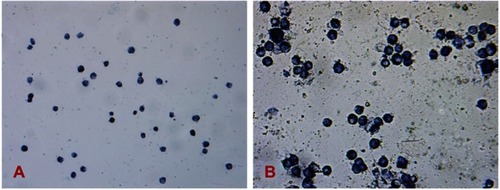
Figure 4 Effects of different dose CeO2NPs on the proliferation rate of primary Leydig cells.
Notes: Compared with the 0 dose level (Solvent), the difference was significant as, *P<0.05, **P<0.01.
Abbreviations: CeO2NPs, cerium oxide nanoparticles; RF, radiofrequency radiation.
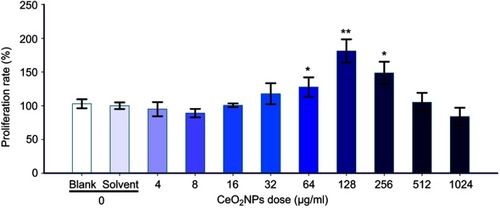
Figure 5 Testosterone concentration in Leydig cells medium treated by CeO2NPs, RF and CeO2NPs + RF.
Notes: Compared with the Solvent Control group, the difference was significant as, *P<0.05, **P<0.01; Compared with the RF group at same exposure time, the difference was significant as, # P<0.05.
Abbreviations: CeO2NPs, cerium oxide nanoparticles; RF, radiofrequency radiation.
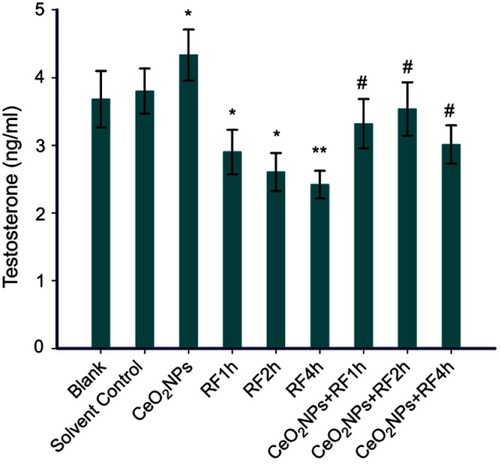
Figure 6 CAT activity in Leydig cells treated by CeO2NPs, RF, and CeO2NPs + RF.
Notes: Compared with the Solvent Control group, the difference was significant as, *P<0.05, **P<0.01; Compared with the RF group at same exposure time, the difference was significant as, # P<0.05, ## P<0.01.
Abbreviations: CeO2NPs, cerium oxide nanoparticles; RF, radiofrequency radiation; CAT, catalase.
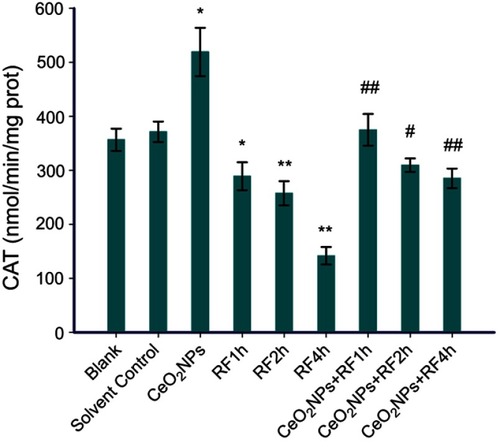
Figure 7 MDA content in Leydig cells treated by CeO2NPs, RF and CeO2NPs + RF.
Notes: Compared with the Solvent Control group, the difference was significant as, **P<0.01; compared with the RF group at same exposure time, the difference was significant as, ## P<0.01.
Abbreviations: CeO2NPs, cerium oxide nanoparticles; RF, radiofrequency radiation; MDA, malondialdehyde.
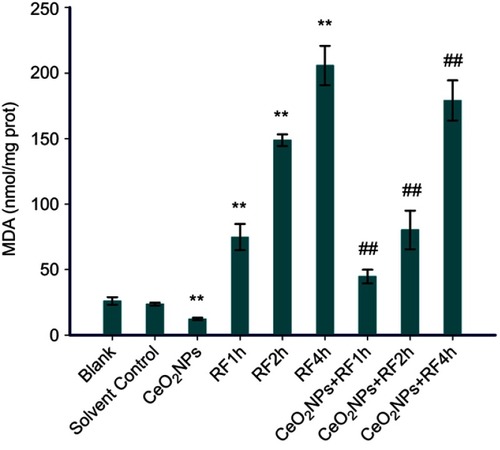
Figure 8 T-AOC levels in Leydig cells treated by CeO2NPs, RF, and CeO2NPs + RF.
Notes: Compared with the Solvent Control group, the difference was significant as, *P<0.05, **P<0.01; Compared with the RF group at same exposure time, the difference was significant as, ## P<0.01.
Abbreviations: CeO2NPs, cerium oxide nanoparticles; RF, radiofrequency radiation; T-AOC, total antioxidation capacity.
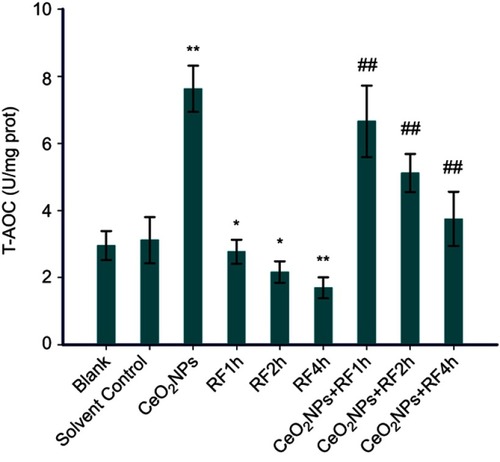
Figure 9 The mRNA expression of testosterone synthase genes (Star, Cyp11a1, Hsd-3β) in Leydig cells treated by CeO2NPs, RF, and CeO2NPs + RF.
Notes: Compared with the Solvent Control group, the difference was significant as, *P<0.05, **P<0.01; Compared with the RF group at same exposure time, the difference was significant as, # P<0.05, ## P<0.01.
Abbreviations: CeO2NPs, cerium oxide nanoparticles; RF, radiofrequency radiation.
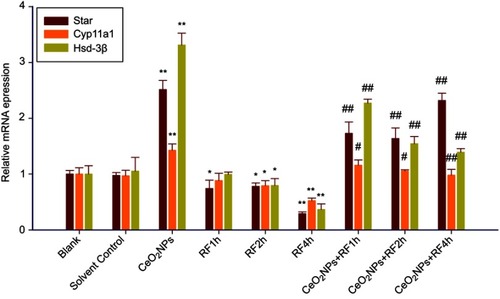
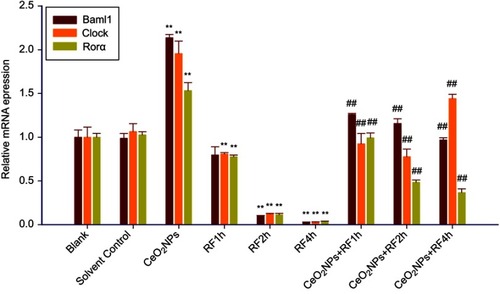
Figure 10 The clock genes (Clock, Bmal1, Rorα) mRNA expression from Real-time PCR in Leydig cells treated by CeO2NPs, RF, and CeO2NPs + RF.
Notes: Compared with the Solvent control group, the difference was significant as, **P<0.01; Compared with the RF group at same exposure time, the difference was significant as, ## P<0.01.
Abbreviations: CeO2NPs, cerium oxide nanoparticles; RF, radiofrequency radiation.