Figures & data

Table 1 Curcumin NLCs formulae prepared according to 3×4 factorial design
Table 2 Particle size, polydispersity index, zeta potential, percentage entrapment efficiency and drug loading for CUR-NLCs
Figure 1 Response surface model (RSM) results for the best formulae (1) GE3 and (2) PE3 showing desirability scores, particle size, polydispersity index, zeta potential, entrapment efficiency percentage and drug loading percentage.
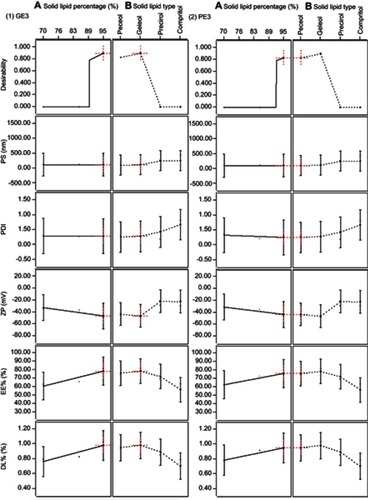
Figure 2 (A and B) Images obtained by transmission electron microscopy (TEM) for (A) PE3 and (B) GE3.
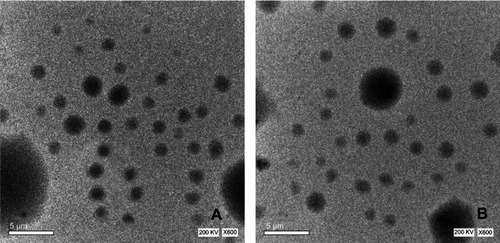
Figure 3 The cumulative percentage of CUR released from PE3 and GE3.
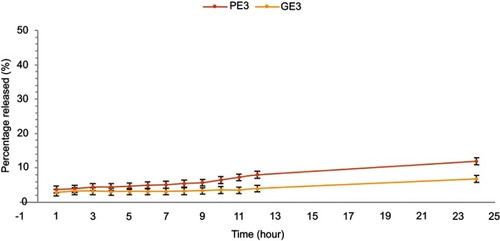
Figure 4 Evaluation of particle size and zeta potential of PE3 and GE3 over the storage period.
Abbreviations: PE, Peceol; GE, Geleol.
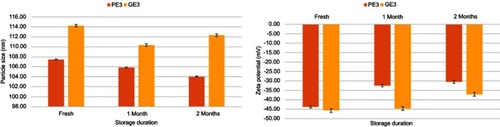
Figure 5 (A–F) Inverted microscope images revealing the effect of 5 µg/mL of each of (A) free CUR (dark), (B) PE3 (dark), (C) GE3 (dark), (D) free CUR (light), (E) PE3 (light) and (F) GE3 (light) on MCF-7 cell line (magnification power 40X).
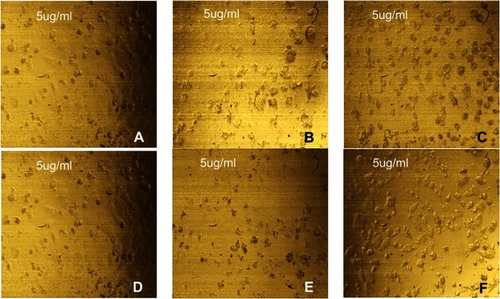
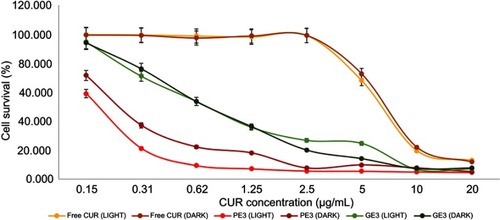
Figure 6 MCF-7 cell survival percentages plot following exposure to free CUR, PE3 and GE3 under dark and light settings.
Abbreviations: CUR, curcumin; PE, Peceol; GE, Geleol.