Figures & data
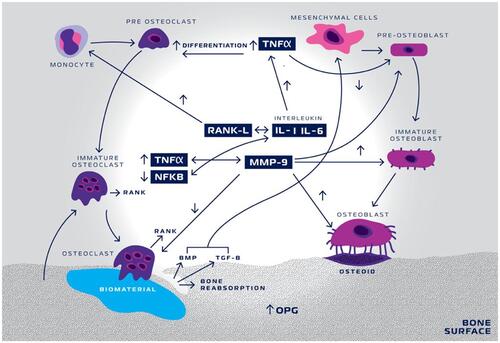
Figure 1 Schematic illustration of a synthetic-HA and/or ß-TCP-based biomaterials influences bone deposition, osteoblast activities, bone resorption, and osteoclast activities.
Figure 2 Scanning electron photomicrography showing nano-HA/ß-TCP mixture with particles size from 130 to 300µm. X 10.000, X 60.000.
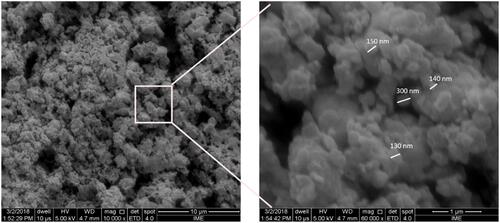
Figure 3 Calvarial samples analyzed sixty days after surgery. X 25 magnification.
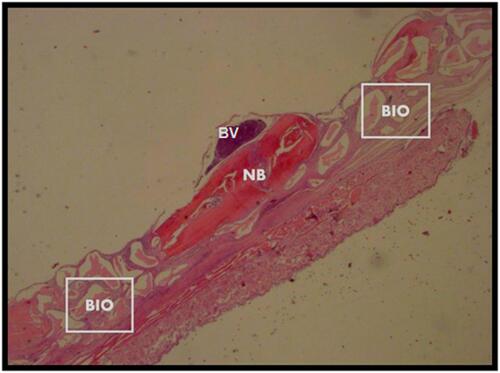
Table 1 Histomorphometric and Immunohistochemical Statistical Analysis
Figure 4 Photomicrographs of slides stained with Masson’s trichrome. The bluish color indicates collagen fibrils in the bone matrix. (A) bone defects filled with hydroxyapatite; (B) bone defects filled with nano-hydroxyapatite/ß tricalcium phosphate; (C) unfilled (control). Scale bar 100 µm, X 400 magnification.
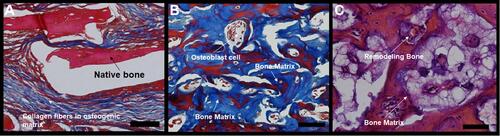
Figure 5 Histomorphometric analysis of Masson’s trichrome-stained area results. Group-1 (micro-HA), Group-2 (nano-HA/ß-TCP compound) and Group-C (without biomaterial - control). *p = 0,0043, #0,0006.
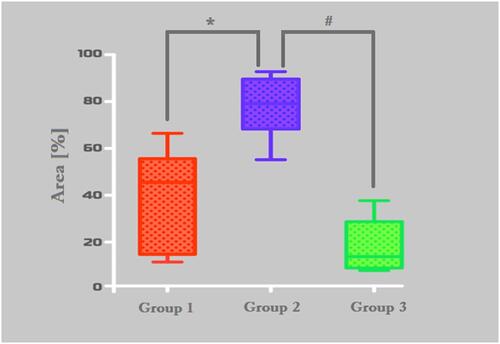
Figure 6 Photomicrographs of slides stained with periodic acid Schiff (PAS). Oxidized hydroxyl and amine/alkylamine chemical groups appear as a magenta-colored complex. The detection of polysaccharides, glycoproteins, and glycolipids suggests new bone formation. (A) bone defects filled with hydroxyapatite; (B) bone defects filled with nano-hydroxyapatite/ß tricalcium phosphate; (C) defect without biomaterial (control). Scale bar 100 µm, X 400 magnification.
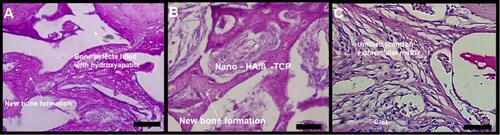
Figure 7 Histomorphometric analysis of PAS stained area. Group-1 (Bio Oss™), Group-2 (Blue Bone™) and Group-C (control). *p = 0,0022, #0,0001.
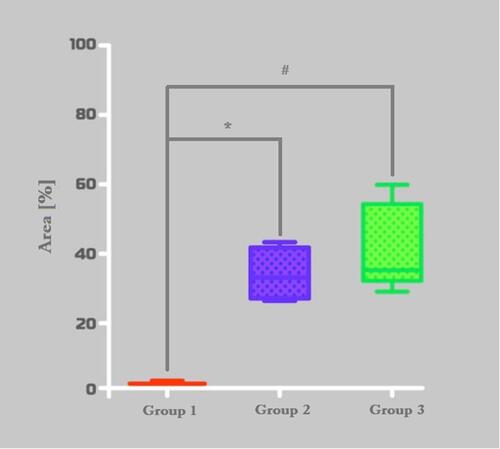
Figure 8 Photomicrographs of MMP-9 immunostained slides, with a light brown color indicating MMP-9. (A) bone defects filled with hydroxyapatite; (B) bone defects filled with nano-hydroxyapatite/ß tricalcium phosphate; (C) defect without biomaterial (control). Scale bar 100 µm, X 400 magnification.
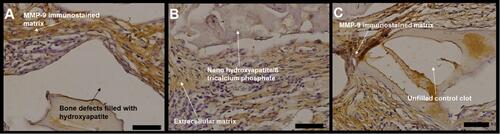
Figure 9 Histomorphometric analysis of MMP-9 stained area. Group-1 (micro-HA), Group-2 (nano-HA/ß-TCP compound) and Group-C (control). *p = 0,0022, #0,0001.
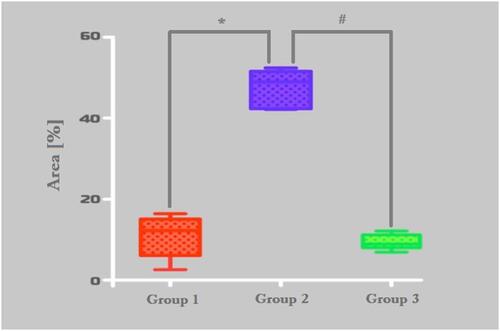
Figure 10 Photomicrographs of TNF-α immunostained slides, with a light brown color indicating the presence of TNF-α. (A) bone defects filled with hydroxyapatite; (B) bone defects filled with nano-hydroxyapatite/ß tricalcium phosphate; (C) unfilled (control). Scale bar 100 µm, X 400 magnification.
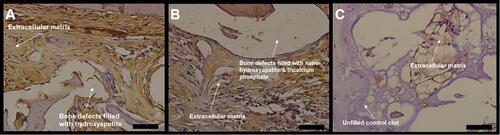
Figure 11 Histomorphometric analysis of TNF-α immunostained area. Group-1 (micro-HA), Group-2 (nano-HA/ß-TCP compound), and Group-C (control). *p = 0,0313.
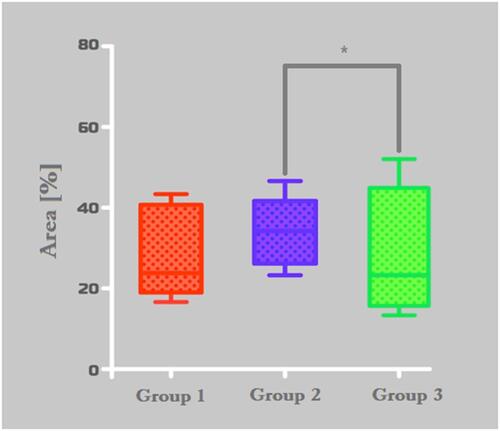
Figure 12 Scanning electron micrographs of bone defects filled with nano-hydroxyapatite/ß tricalcium phosphate showing bone matrix surface, highlighting hydroxyapatite crystals (light and dark blue) in contact with proteinaceous matrix component. Scale bar = 50 µm, x500 magnification. Magnified image = Scale bar = 20 µm, X 2375.
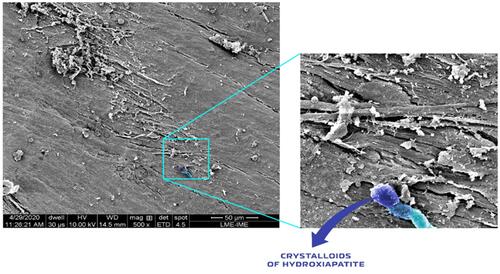
Figure 13 Scanning electron micrographs of bone defects filled with nano-hydroxyapatite/ß tricalcium phosphate showing the surface of the bone matrix. The highlighting images are suggestive of collagen fibrils (yellow), collagen fibrils associated with other types of proteins (magenta) and possibly starting the process of the extracellular matrix formed by an aggregate of glycoproteins and bundles of collagen fibers; and a fibroblast (red). (A) scale bar = 40 µm, x1000; (B) scale bar 100 µm, X 250 magnification.
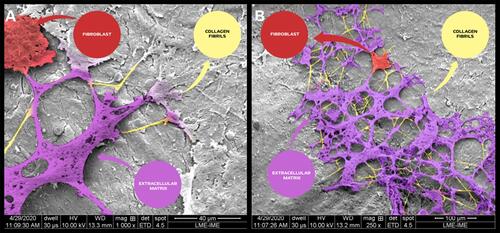
Figure 14 Schematic representation of TNF-α and MMP-9 activity in biomaterial inducing-bone remodeling. Nano-hydroxyapatite/beta-tricalcium phosphate (biomaterial) triggers a cascade of events initiated by tumor necrosis factor- α (TNF-α) increase, activating interleukin-1 (IL-1) and interleukin-6 (IL-6). IL-1 and IL-6 decrease the activity of Nuclear-Factor Kappa-ß (NFKB) and consequently increase the activity of the receptor.