Figures & data
Figure 1 Selection of microscopy systems which are capable of or can be modified for reflectance- or scattering-based localization of label-free nanoparticles (The pictures are merely intended to illustrate the large number of possible microscopy systems and are not supposed to represent an explicit microscope type or manufacturer). (Image created with BioRender.com).
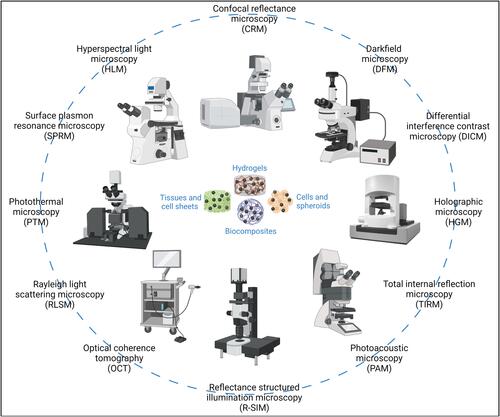
Figure 2 Cellular uptake of nanoparticles (SPIONPAM). (A–E) Imaging of SPION-labeled cells using (A and B) fluorescence labelling (A: phalloidin, green; B: Hoechst, blue), (C) transmission (grey) and (D) reflectance (glow) mode. (E) Merged and detailed view of the sample showed in (A–D). (F and G) Image sections of the 3D video (Supplementary Video 1) from the sample shown in (A–E). For materials and methods see supplement. Images were captured by Karl-Heinz Körtje at Leica Microsystems GmbH.
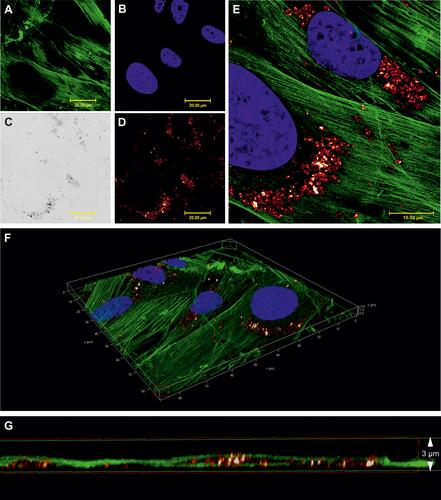
Figure 3 Image resolution of SPIONPAM clusters. (A and B) SPIONPAM-labelled cells. (B) Magnified reflectance image of the framed section in (A). (C) Intensity profile in the region of interest (ROI 1) in (B) indicating the full width half maximum of the selected nanoparticle objects. For materials and methods see supplement. Images were captured by Karl-Heinz Körtje at Leica Microsystems GmbH.
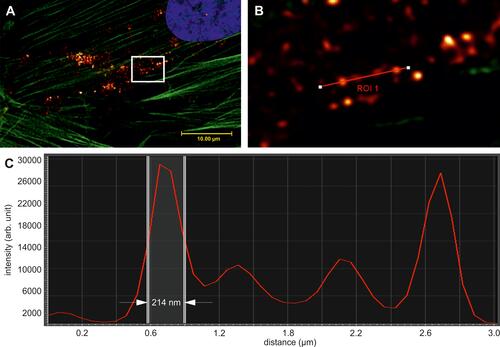
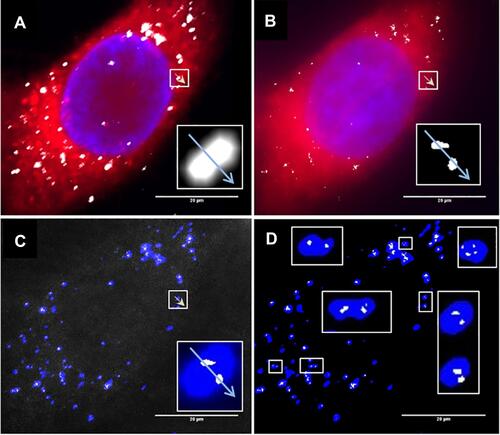
Figure 4 Retinal pigment epithelial cells (ARPE-19) incubated with 3 µg/mL AgNP. (A) Darkfield image, (B) Merged image of (C and D) and DAPI staining, (C) CellMask Orange plasma membrane staining, (D) Cells transfected with Mito-GFP (green). Magnification 600x. Pictures were done by darkfield optics using a 60-x plan Fluor objective with an iris diaphragm (NA 0.55–0.90). Reproduced from Zucker RM, Ortenzio J, Degn LL, Boyes WK. Detection of large extracellular silver nanoparticle rings observed during mitosis using darkfield microscopy. PLoS One. 2020;15(12):e0240268. The work is made available under the Creative Commons CC0 public domain dedicationCitation62.
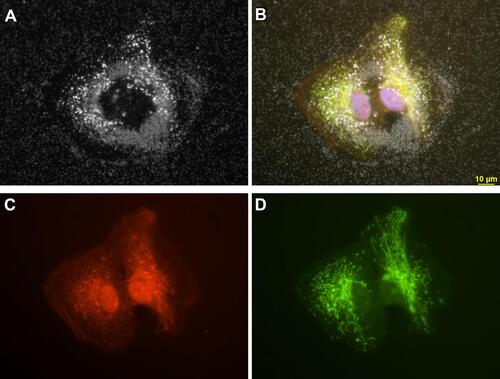
Figure 5 Workflow of data analysis and mapping in hyperspectral microscopy.
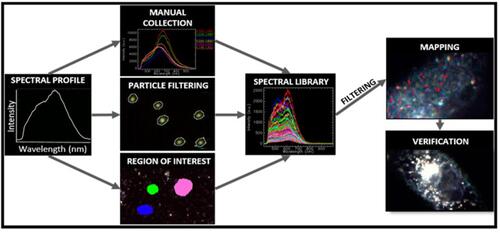
Figure 6 Sensitivity of Confocal Reflectance Microscopy (CRM) and Reflectance Structured Illumination Microscopy (R-SIM). HeLa cells were treated with cerium dioxide NPs. (A) CRM and (B) R-SIM show cytoplasmic stain (CTDR, red), nuclear stain (DAPI, blue) and NP signal (grey). Overlay of the cerium dioxide NP regions show particles detected in CRM (blue) and SIM (grey) in both the raw (C) and processed (D) images. White boxes display a sample of regions where CRM detects one spot and SIM detects multiple spots, illustrating the enhanced resolution of SIM. Reproduced from Guggenheim EJ, Khan A, Pike J, Chang L, Lynch I, Rappoport JZ. Comparison of Confocal and Super-Resolution Reflectance Imaging of Metal Oxide Nanoparticles. PLoS One. 2016;11(10):e0159980. © 2016 Guggenheim et al. This is an open access article distributed under the terms of the Creative Commons Attribution LicenseCitation181.