Figures & data
Schematic 1 This paper’s schematic diagram. FTY720-CDs@GelMA hydrogel was prepared, filled with NSCs, and implanted into a rat spinal cord total transection damage model. This combination therapy enhances nerve regeneration and functional recovery by boosting the proliferation and differentiation of endogenous neural stem cells into neurons, while also drastically reducing gliogenesis at the lesion site.
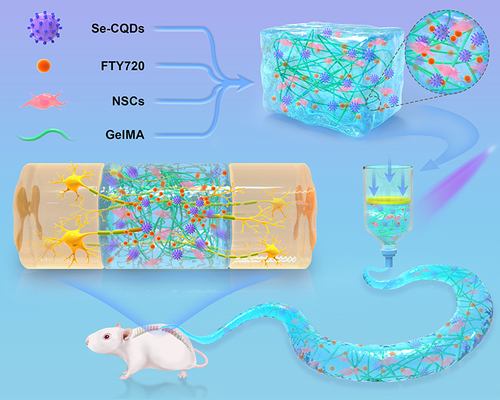
Table 1 Primer Sequences
Figure 1 Characterization of the prepared carbon dots. (A) TEM image of the CDs. A1: low magnification, scale bar:50 nm; A2: high magnification, scale bar:10 nm. (B) FTIR results of the prepared carbon dots. (C) XPS spectra of the prepared carbon dots.
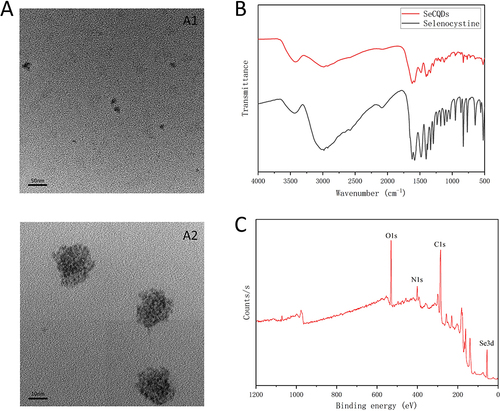
Figure 2 Characterization of different groups of hydrogels prepared. (A) External image of different groups of hydrogels formed into gel. (B) Pore structure of different hydrogels under scanning electron microscope. Scale bar: 500 μm.
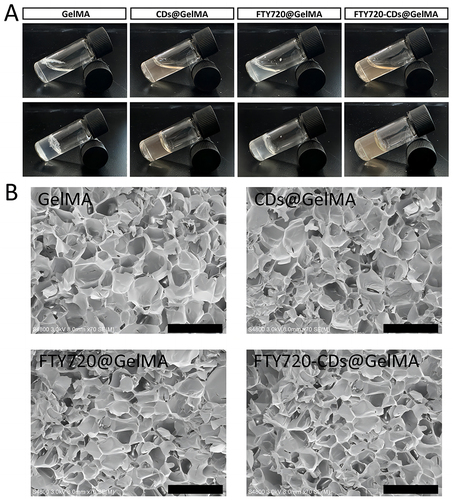
Figure 3 Characterization and reactive oxygen scavenging capacity of different groups of hydrogels. (A) Diameter size of different hydrogel pores. (B) Dissolution rate of different groups of hydrogels. (C) Degradation time curve of different groups of hydrogels. (D) Free radical scavenging capacity of different groups of hydrogels. *P<0.05.
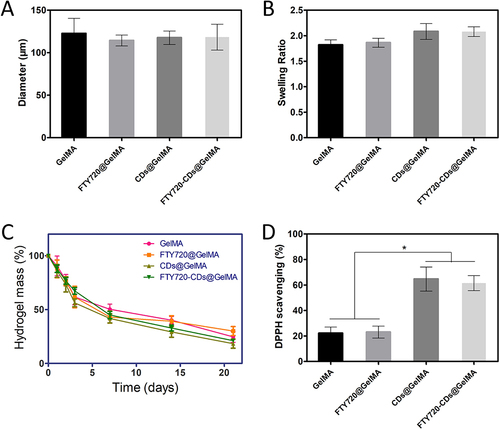
Figure 4 Live-dead staining images of NSCs after culture in different groups of hydrogels. (A) Live-dead staining; green: live cells; red: dead cells. Scale bar: 200 μm. (B) survival of neural stem cells in different groups of hydrogels.
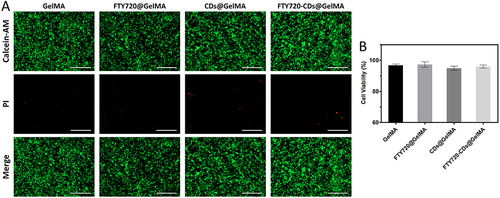
Figure 5 Histological morphology of major organs (heart, kidney, liver and spleen) after implantation of different types of hydrogels. Shown in the figure are Control: blank control group; GelMA: injectable hydrogel group alone; FTY720@GelMA: injectable hydrogel group loaded with FTY720; CDs@GelMA: injectable hydrogel group loaded with CDs; FTY720-CDs@GelMA: injectable hydrogel group loaded with FTY720 and CDs. FTY720-CDs@GelMA: injectable hydrogel set loaded with FTY720 and CDs. Scale bar: 200μm.
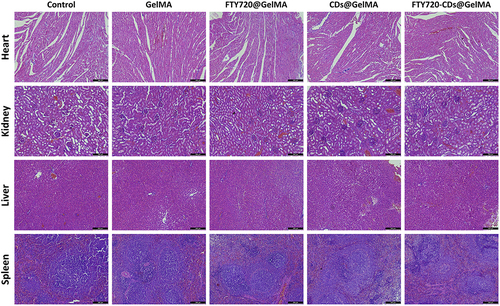
Figure 6 Scavenging of reactive oxygen species by different groups of hydrogels. (A) DCFH images of different groups of hydrogels. Scale bar: 200 μm. (B) DHE images of different groups of hydrogels. Scale bar: 200 μm. (C) average fluorescence intensity of hydrogels of different groups. (D) DHE fluorescence intensity of different groups. *Indicates P<0.05.
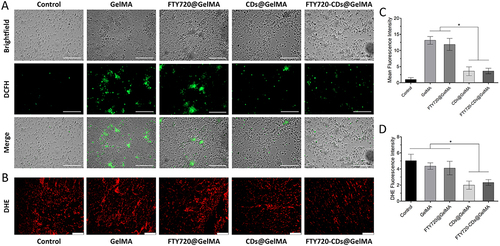
Figure 7 Proliferation of NSCs in different hydrogels. (A) Identification of isolated cells, which were spherical in shape and positively expressed Nestin (green). Cell nuclei were stained with DAPI (blue). Scale bar: 100 μm; (B) Normal growth of neural stem cells in hydrogels. Cell nuclei were stained with DAPI (blue) and neurons were stained with Tuj-1 (red), scale bar: 100 μm; (C) Absorbance measurements of different groups of hydrogels; (D) Expression of newborn neurons in different groups of hydrogels; (E) Expression of astrocytes in different groups of hydrogels. *Indicates P<0.05.
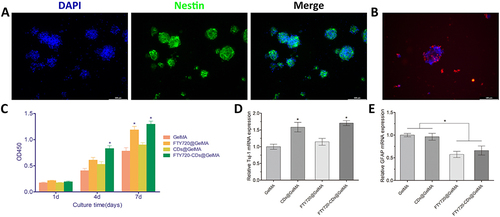
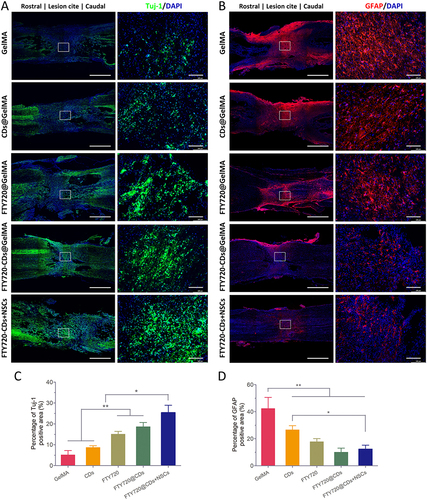
Figure 8 Regeneration of neurons at the lesion site in different groups. (A) Staining of newborn neurons and astrocyte staining and their fusion plots in different groups of hydrogels. Cell nuclei were stained with DAPI (blue), newborn neurons were stained with Tuj-1 (red), and astrocytes were stained with GFAP (red). Scale bar: 200 μm. (B) quantitative expression of newborn neurons (Tuj-1). (C) quantitative expression of astrocytes (GFAP). *, *** are P<0.05 and P<0.001, respectively.
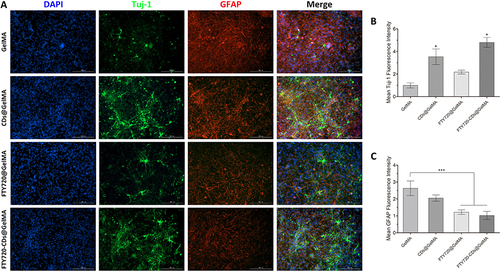
Figure 9 Evaluation of motor function recovery and tissue repair in rats 8 weeks after spinal cord injury. (A) HE staining of rat spinal cord in each group. Left: scale bar: 500 μm; right: scale bar: 100 μm. (B) LFB staining of the spinal cord of each group. The image on the right is a magnified image of the area shown in the black square on the left. Left: scale bar: 500 μm; right: scale bar: 100 μm. (C) BBB scores of different groups at 8 weeks post-injury. (D) Percentage of cavity area in each group. (E) Percentage of LFB-positive area in each group. *Indicates P<0.05.
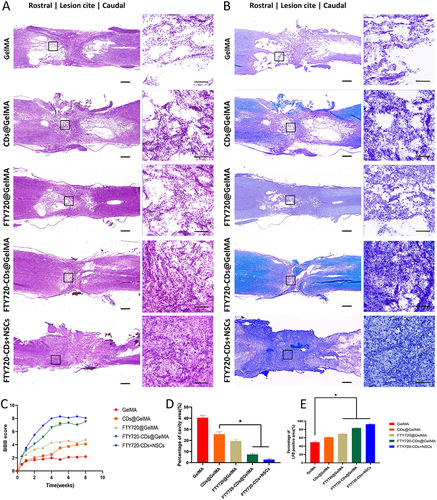
Figure 10 (A) Regeneration of neurons at the lesion site in different groups. Scale bar: 100 μm. (B) nerve fiber regeneration and axonal myelin re-formation in different groups. Scale bar: 100μm. (C) Percentage of Tuj-1 positive area in different groups. (D) Percentage of GFAP positive area in different groups. *, **P<0.05 and P<0.01, respectively.