Figures & data
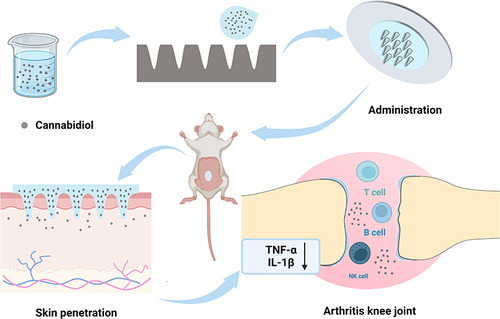
Figure 1 Chemical structures of CBD.
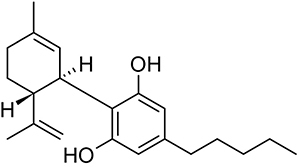
Figure 2 The scheme of CBD-NS and CBD-NS DMN preparation.
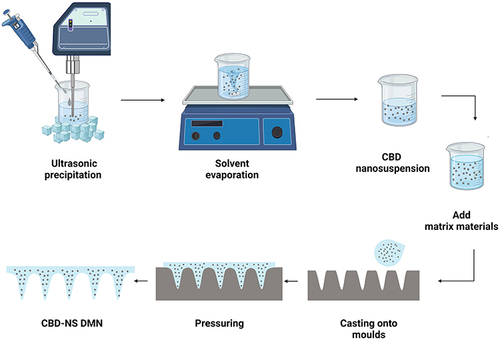
Figure 3 Different formulations of (A) the particle size; (B) PDI (C) zeta potential; (D) the particle size distributions; (E) magnification 100 kx SEM image and (F) magnification 100 kx TEM image of Tween 80-CBD-NS, scale bar = 200 nm.
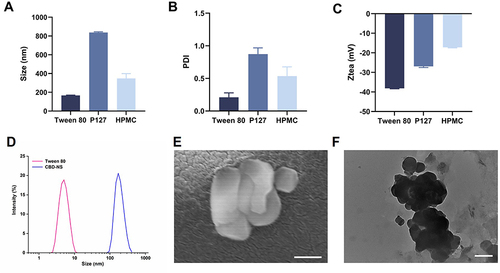
Figure 4 (A) SEM images of Blank DMN (A1) magnification 60x; (A2) magnification 1000x and (A3) magnification 5000x. (B) CBD (pure drug). (B) Scanning microscopy images of CBD-NS DMN (B1) magnification 60x; (B2) magnification 1000x and (B3) magnification 5000x. (C) Images of Blank DMN dissolution in skin over time (C1) 0 min; (C2) 1 min; (C3) 5 min and (C4) 10 min, scale bar = 500 μm. (D) Images of CBD-NS DMN dissolution in skin over time (D1) 0 min; (D2) 1 min; (D3) 5 min and (D4) 10 min, scale bar = 500 μm.
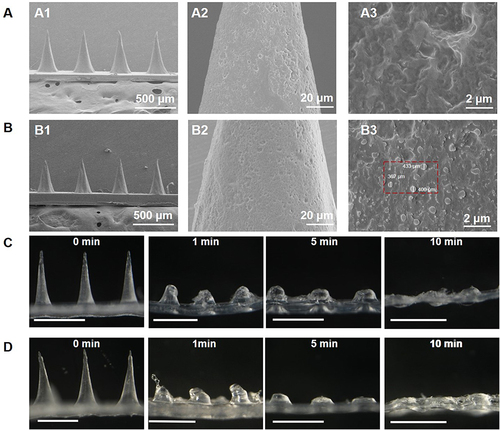
Figure 5 (A) Mechanical performance of CBD-NS DMN. (B) DSC analysis of CBD (pure drug), Blank DMN and CBD-NS DMN. (C) XRD analysis of CBD (pure drug), Blank DMN and CBD-NS DMN. (C1) 2 Theta range 5–60° and (C2) 2 Theta range 5–20°.

Figure 6 (A) Images of porcine skin after treatment with C6 DMN (A1) Bright-field image; (A2) Fluorescence microscopy. (B) Insert depth obtained by CLSM 3D reconstruction, scale bar = 500 μm. (C) In vivo imaging of rats after being treated with C6, (C1) In vivo images throughout 48 h and (C2) the curve of fluorescence intensity with time.
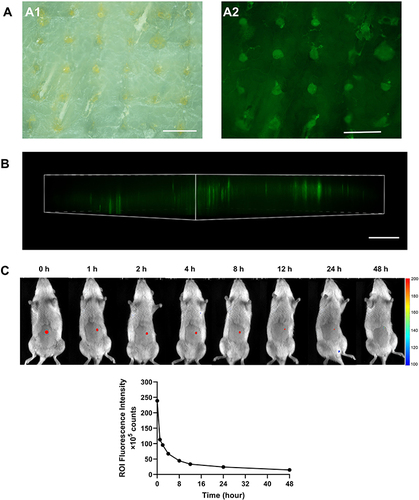
Table 1 Fitting of in vitro Release Test Curves
Figure 7 (A) In vitro cumulative release curve of CBD-NS DMN in 2% Tween 80. (B) The residual ratio of CBD above the skin (blue line), and the accumulative amount of CBD entering the skin (red line). Data are represented as mean ± S.D., n = 4.
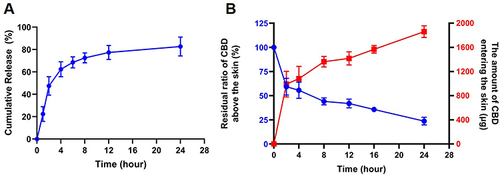
Table 2 CBD Concentration in the Skin After CBD-NS DMN Administration at the Application Site (Mean ± S.D., n = 4)
Table 3 Pharmacokinetic Parameters of CBD in SD Rats After Oral Administration and Administration of DMN (Mean ± S.D., n = 6)
Figure 8 Treatment of rat model of knee synovitis induced by kaolin/λ-carrageenan. (A) Images of the knee joints from the Model, MTX S.C. and CBD-NS DMN; (B) Statistics of knee swelling degree and (C) Changes in body weight of rats after one week of treatment with different groups. (D) The serum of rats was used to detect inflammatory factors, including (D1) TNF-α and (D2) IL-1β. (E) Histopathological evaluation of knee joint in kaolin/carrageenan-induced knee synovitis model rats. H&E staining images of Naive, Model, MTX S.C. and CBD-NS DMN (Magnification 10×). Scale bar = 200 μm. Data are represented as mean ± S.D., n = 5. The “*” represents the significant difference between each group and the model group, specifically *p < 0.05, **p < 0.01, ***p < 0.001 and ****p < 0.0001. The “ns” represents no significant difference between the groups and the naive group.
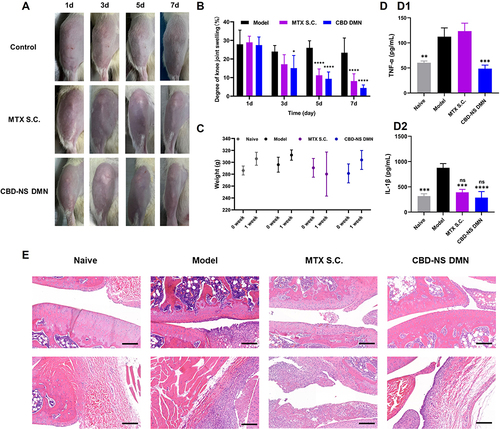
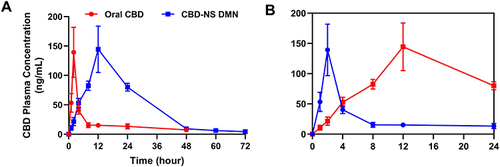
Figure 9 CBD pharmacokinetic curves in the blood of SD rats after oral administration and administration of DMN (A) 0–72h; (B) 0–24h. Data are represented as mean ± S.D., n = 5.