Figures & data
Scheme 1 Schematic diagram of the C-dots@Gel preparation and its effect on dry eye disease (DED).
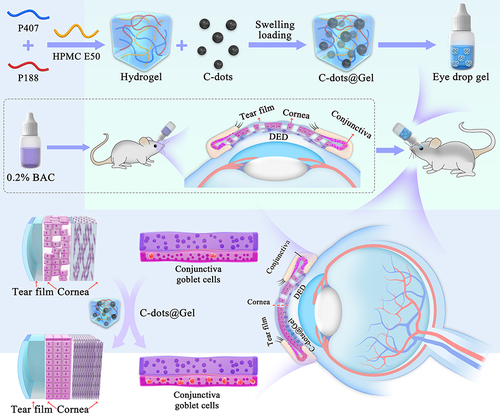
Figure 1 The properties of the C-dots. (A) The capacity of C-dots to eliminate ·O2−. (B) The SOD-like activity in the C-dots of different concentrations. (C) The ABTS radical scavenging ability of the C-dots.
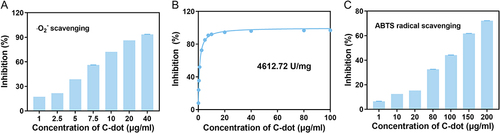
Figure 2 Three-dimensional 3D response surface and contour plot showing the effect of T1, T2, and gelation time. (A) Y1 (Gelation temperature T1), and (B) Y2 (Gelation temperature T2) before and after simulated tear dilution. (C) Y3 (Gelation time). (D–F) The contour map is 3D with a projection at the bottom, corresponding to (A–C).
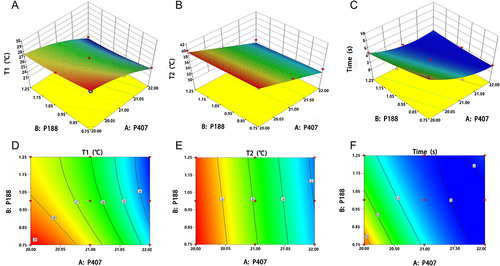
Figure 3 Appearance of gels. (A) Gelation capacity. (B) The appearance of different concentrations of C-dots loading into blank in situ gel (1 to 7 represents the concentration of 100, 80, 40, 20, 10, 5, and 2.5 μg/mL, respectively). (C and D) Blank gel and (E and F) C-dots@gel at gelation temperature.
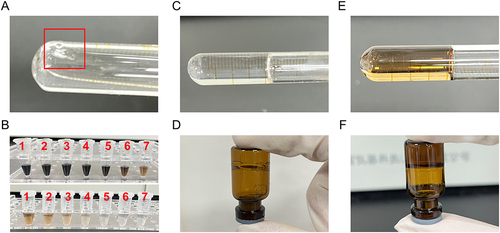
Figure 4 The pictures of gelling on the ocular surface. (A) blank Gel. (B and C) C-dots@Gel (20 μg/mL and 40 μg/mL).
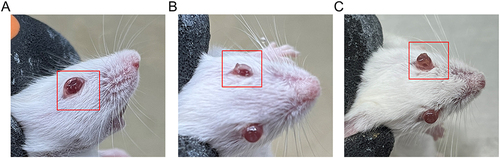
Figure 5 Precorneal Retention Time evaluation. Precorneal retention of sodium fluorescein that loaded C-dots and C-dots @ Gel after topical instillation in mice eye.
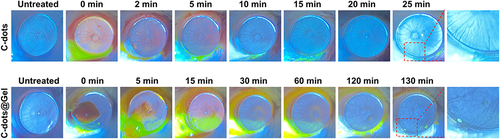
Figure 6 The ocular surface irritation. (A) The images of corneal fluorescein sodium staining. (B) Histopathology images of ocular tissues (cornea, conjunctiva, iris, retina). Scale bar: 100 μm.
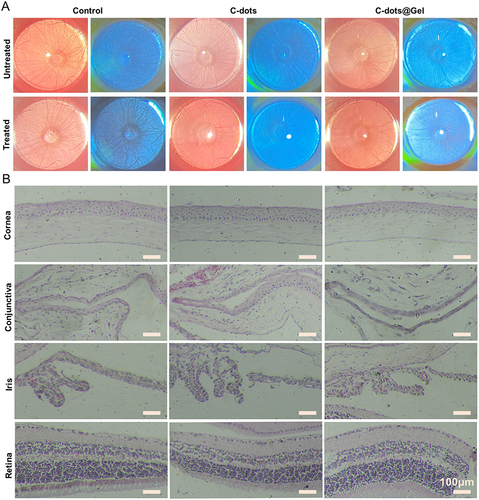
Figure 7 The biocompatibility in vivo. (A) Representative histological images of the heart, liver, spleen, lung, and kidney. Scale bar: 100 μm. (B–E) Main indexes of RBC, WBC, PLT, and HGB blood routine examination. ns, no significance.
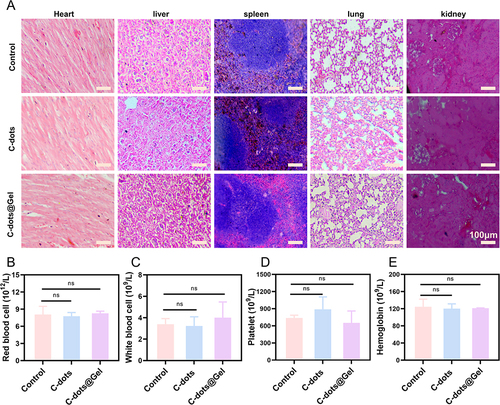
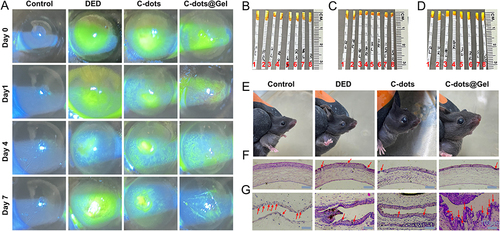
Figure 8 Estabilishment of DED model and In vivo therapeutic effect of Dry eye disease. (A) The flow chart of the experiment. (B) Tear secretion test diagram. (C) Schirmer I test, (D) Tear film break-up time, (E) Corneal fluorescein staining scores, and (F) Body weight during the preparation of the DED model. (G) Schirmer I test, (H) Tear film break-up time, (I) Corneal fluorescein staining scores, and (J) Body weight of the DED mice after treatment with C-dots or C-dots@Gel for 7 days (n=3) *, P <0.05; **, P < 0.01; ***, P < 0.001.
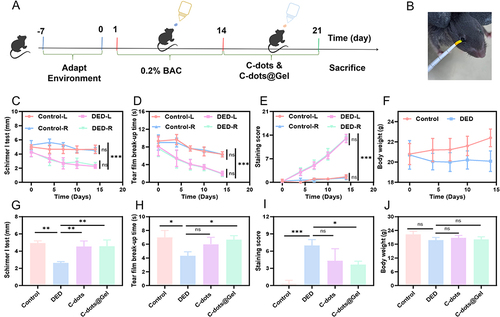
Figure 9 In vivo therapeutic effect of Dry eye disease. (A) Images of the fluorescein staining. (B-D) Tear filter strip diagram of normal mice (B), DED mice (C), and DED mice after dropping C-dots or C-dots@Gel on the eye surface (D) (Control (1, 2), DED (3, 4), C-dots (5, 6), C-dots@Gel (7, 8). L-Left eye, R-Right eye). (E) Appearance of mouse eye surface. (F and G) Histological images of cornea and conjunctiva from normal mice, DED mice, and DED mice treated with C-dots or C-dots@Gel for 7 days. (F) The corneal is indicated by the red arrows. Scale bar: 100 μm. (G) Goblet cells in the conjunctiva are indicated by the red arrows. Scale bar: 100 μm.