
Figures & data
Table 1 Summary of NPs characterization in water
Table 2 Summary of NP dosimetry
Figure 1 Raw 264.7 cell viability after pretreatment with increasing concentrations of NPs.
Notes: (A) Cell viability compared to control as measured by PI. (B) Cell viability as compared to control as measured by calcein AM. Graphs show average and SEM (N=6). *P<0.05 is considered statistically significant as determined by two-way ANOVA followed by Bonferroni post-test comparing treated cells to control cells. APAP concentration was equal to 25 mM.
Abbreviations: NPs, nanoparticles; PI, propidium iodide; SEM, standard error of the mean; ANOVA, analysis of variance; APAP, acetaminophen; calcein AM, acetomethoxy derivate of calcein; h, hours; ND, not determined.
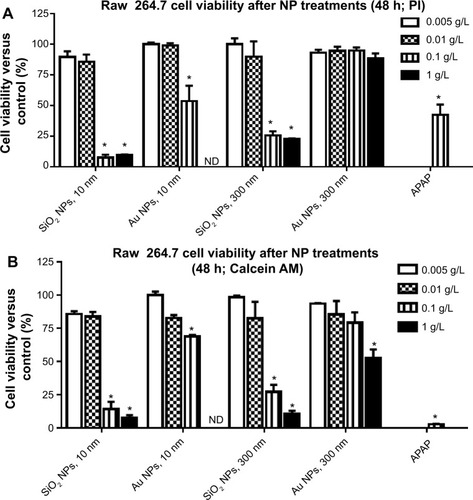
Figure 2 Detection of macrophage incorporation of NPs.
Notes: For A, B, and C, the narrow arrow points out individual NPs within the TEM image. (A) SiO2 NPs (10 nm) with corresponding mapping of elemental Si, O, and C, indicating the presence of the SiO2 NPs. Scale bar =500 nm. NP agglomerates indicated by bold arrow. (B) Au NPs (10 nm) with corresponding EDS spectrum showing the presence of Au. Scale bar =2,000 nm. (C) SiO2 NPs (300 nm) with corresponding EDS spectrum showing the presence of Si. Scale bar =1,000 nm. Note that the TEM images are prepared without traditional post-staining. (D) Au NPs (300 nm) with NP incorporation indicated by confocal microscopy for an entire cell monolayer. White arrow indicates Au NPs within the cell. Corresponding 3D reconstruction indicates NP incorporation within the cell monolayer (brightness/contrast adjusted 60/50, respectively). Scale bar =50 μm. Blue is DAPI-stained nuclei, while red color is reflectance from Au NPs.
Abbreviations: NPs, nanoparticles; EDS, energy dispersive X-ray analysis; TEM, transmission electron microscopy; DAPI, 4′,6-diamidino-2-phenylindole.
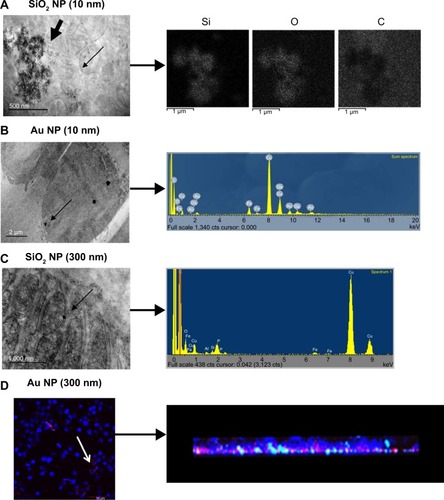
Figure 3 RAW 264.7 cells were exposed to NPs for variable time points and the cell number and cell cycle were determined by Coulter counter measurements and flow cytometry, respectively.
Notes: There is a significant decrease at 48 hours in cells treated with (A) 10 nm SiO2 NPs, (B) 10 nm Au NPs, and (C) 300 nm SiO2 NPs. (D) Au NPs (300 nm)-treated cells do not show changes in cell number. LPS was used as a positive control and LPS treatments caused a decrease in cell number. Cell cycle analysis of NPs-treated RAW 264.7 cells was performed on FacsAria III using DIVA software. Significant differences in cell cycle status were detected only in SiO2 NPs (10 nm)-treated cells after (E) 24 hours and (F) 48 hours. Graphs (A–F) show mean values with SEM (N=7–12). *P<0.05 is considered statistically significant as determined by two-way ANOVA followed by Bonferroni post-test comparing treated cells to control.
Abbreviations: NPs, nanoparticles; LPS, lipopolysaccharide; SEM, standard error of the mean; ANOVA, analysis of variance.
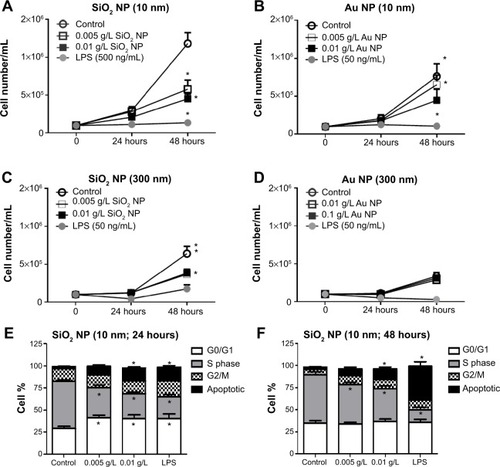
Figure 4 RAW 264.7 cells were exposed to NPs for variable time points, and supernatants harvested and used for ELISAs.
Notes: (A) SiO2 NPs (10 nm) had a quenching effect on TNF-α. There is an increase in TNF-α production in RAW 264.7 cells exposed to 0.01 g/L SiO2 NPs. Results are represented as (B) pg/mL and (C) ng/cell number. Graphs show average and SEM (N=6–11). *P<0.05 is considered statistically significant as determined by two-way ANOVA followed by Bonferroni post-test comparing treated cells to control.
Abbreviations: NPs, nanoparticles; ELISA, enzyme-linked immunosorbent assay; TNF, tumor necrosis factor; SEM, standard error of the mean; ANOVA, analysis of variance; LPS, lipopolysaccharide.
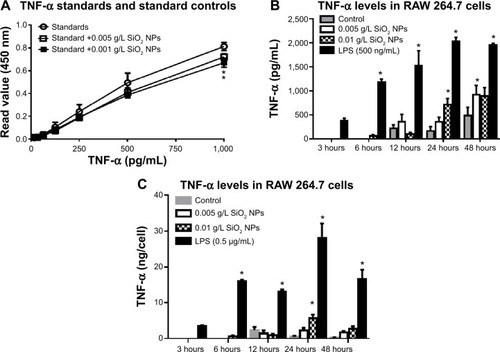
Figure 5 RAW 264.7 cells were exposed to NPs for variable time points after which phagocytosis was performed using opsonized FITC-Escherichia coli bioparticles.
Notes: There is a decrease in phagocytosis in RAW 264.7 cells treated with (A) 10 nm SiO2 NPs, (B) 10 nm Au NPs, and (D) 300 nm Au NPs. (C) Although there is a slight decrease in phagocytosis in RAW 264.7 cells treated with 300 nm SiO2 NPs, the decrease is only significant for the 0.005 g/L dose at the 48-hour time point. (E) SiO2 NPs (300 nm) do not interfere with the phagocytosis assay. (F) Au NPs (10 nm and 300 nm) interfered with FITC-E. coli bioparticles phagocytosis assay on flow cytometer. Au NP (0.01 g/L)-spiked controls showed approximately twofold decrease in MFI values versus control cells. Graphs (A–E) show fold change in MFI versus controls (N=6, two independent experiments). *P<0.05 is considered statistically significant as determined by two-way ANOVA followed by Bonferroni post-test (note that two-way ANOVA significance was also identified without post hoc testing).
Abbreviations: NPs, nanoparticles; MFI, mean fluorescence intensity; ANOVA, analysis of variance; LPS, lipopolysaccharide; vs, versus; h, hours.
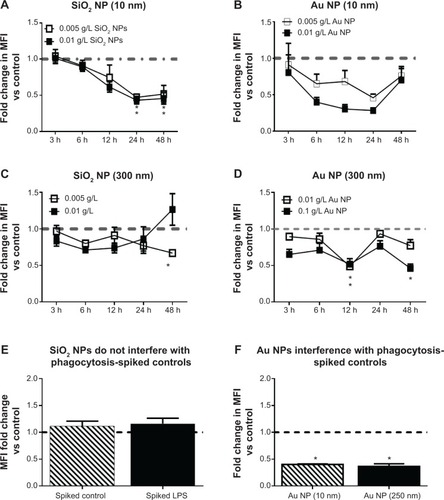
Figure 6 Confocal evaluation of FITC-E. coli bioparticle internalization.
Notes: (A) RAW 264.7 cells pretreated with SiO2 NPs (10 nm). Brightness/contrast adjusted 60/50, respectively. Blue is DAPI-stained nuclei and green is FITC-E. coli. (B) Confocal analysis minimizes Au NP quenching effects observed with flow cytometry and (C) allows for semiquantitative analysis of phagocytosis. (D) RAW cells pretreated with Au NPs (300 nm). Brightness/contrast adjusted 60/50, respectively. Blue is DAPI-stained nuclei, green is FITC-E. coli, and red is reflection from Au NPs.
Abbreviations: NPs, nanoparticles; DAPI, 4′,6-diamidino-2-phenylindole; LPS, lipopolysaccharide.
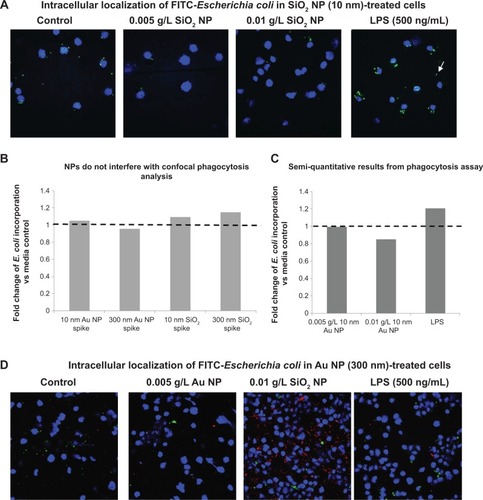
Table 3 Summary of functional assays
Figure S1 NPs were analyzed by TEM and DLS in water.
Notes: (A) SiO2 NPs (10 nm); (B) SiO2 NPs (300 nm); (C) Au NP (10 nm); (D) Au NP (300 nm). Scale bars for TEM were 100 nm for the smaller NPs and 500 nm for the larger NPs. Arrows point out singlet NPs (solid arrow) or agglomeration (punctuated arrow) in TEM grids. DLS shows intensity-weighted particle distribution.
Abbreviations: NPs, nanoparticles; TEM, transmission electron microscopy; DLS, dynamic light scattering.
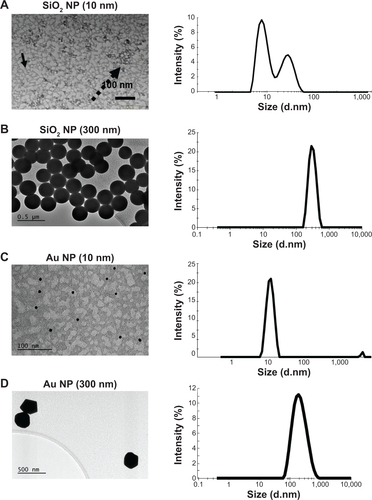
Figure S2 RAW 264.7 cells were exposed to NPs for variable time points and the cell cycle was determined flow cytometry.
Notes: There is no significant change in the cell cycle parameters for either (A) 10 nm Au NPs or (B) 300 nm SiO2 NPs. Graphs show mean values with SEM (N=7–12). *P<0.05 is considered statistically significant as determined by two-way ANOVA followed by Bonferroni post-test. (C) A representative dot-plot analysis of the cell cycle for cells treated with SiO2 NPs (10 nm).
Abbreviations: NPs, nanoparticles; SEM, standard error of the mean; ANOVA, analysis of variance; LPS, lipopolysaccharide; Ap, apoptosis; 7AAD, 7-Aminoactinomycin D.
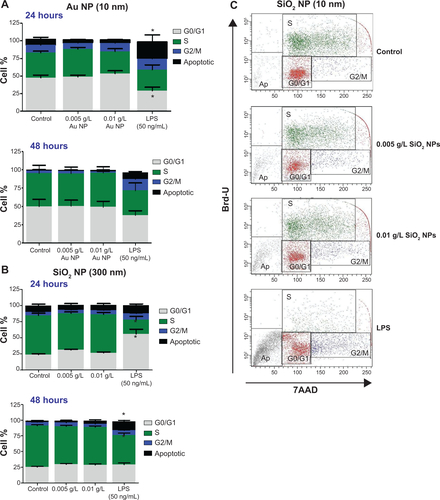
Figure S3 RAW 264.7 cells were exposed to NPs for variable times, supernatants harvested, and used for ELISAs.
Notes: TNF-α levels are represented as pg/mL. Standards and standards spiked with NPs are shown on the right, and show no statistical significance between the unspiked standards. (A) Au NPs (10 nm), (B) SiO2 NPs (300 nm), and (C) Au NPs (300 nm) did not have an effect on TNF-α production. Graphs show average and SEM (N=6). *P<0.05 is considered statistically significant as determined by two-way ANOVA followed by Bonferroni post-test comparing treated cells to control.
Abbreviations: NPs, nanoparticles; ELISA, enzyme-linked immunosorbent assay; TNF, tumor necrosis factor; SEM, standard error of the mean; ANOVA, analysis of variance; OD, optical density; LPS, lipopolysaccharide.
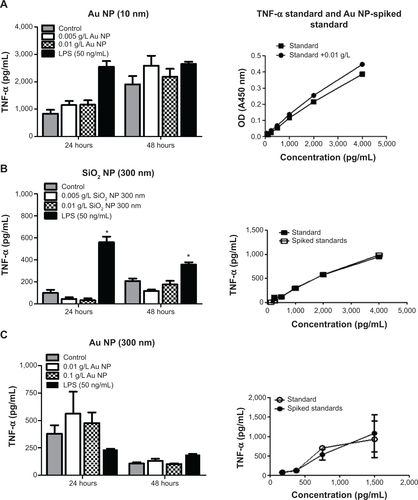
Figure S4 RAW 264.7 cells were exposed to NPs for variable times, supernatants harvested, and used for ELISAs.
Notes: IL-6 levels are represented as pg/mL. (A) SiO2 NPs (10 nm), (B) Au NPs (10 nm), (C) SiO2 NPs (300 nm), and (D) Au NPs (300 nm) did not have an effect on IL-6 production. (E) Evaluation between standards and standards spiked with SiO2 NPs (300 nm). (F) Evaluation between standards and standards spiked with Au NPs (10 nm). Graphs show average and SEM (N=6). *P<0.05 is considered statistically significant as determined by two-way ANOVA followed by Bonferroni post-test comparing treated cells to control.
Abbreviations: NPs, nanoparticles; ELISA, enzyme-linked immunosorbent assay; IL, interleukin; SEM, standard error of the mean; ANOVA, analysis of variance; LPS, lipopolysaccharide; OD, optical density; h, hours.
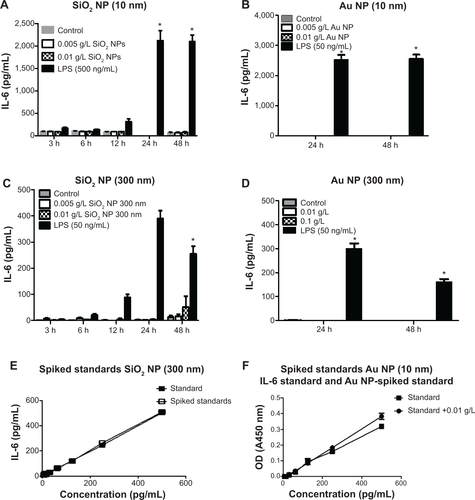
Figure S5 RAW 264.7 cells were exposed to NPs for variable times, supernatants harvested, and used for ELISAs.
Notes: IL-10 levels are represented as pg/mL. (A) SiO2 NPs (10 nm), (B) Au NPs (10 nm), (C) SiO2 NPs (300 nm), and (D) Au NPs (300 nm) did not have an effect on IL-10 production. (E) Evaluation between standards and standards spiked with SiO2 NPs (300 nm). (F) Evaluation between standards and standards spiked with Au NPs (10 nm). Graphs show average and SEM (N=6). *P<0.05 is considered statistically significant as determined by two-way ANOVA followed by Bonferroni post-test comparing treated cells to control.
Abbreviations: NPs, nanoparticles; ELISA, enzyme-linked immunosorbent assay; IL, interleukin; SEM, standard error of the mean; ANOVA, analysis of variance; LPS, lipopolysaccharide; OD, optical density; h, hours.
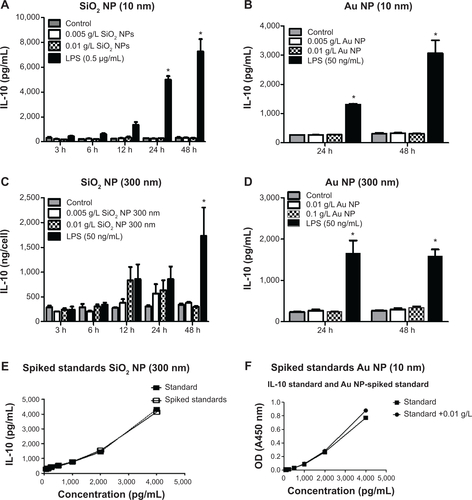
Figure S6 RAW 264.7 cells were exposed to SiO2 NPs (10 nm) for variable times, and cells were harvested and stained for CD80, CD86, and CD40.
Notes: Cells were analyzed on FacsAria III using DIVA software. SiO2 NPs (10 nm) had little to no effect on the expression of CD80, CD86, and CD40. Graphs show average and SEM (N=6). *P<0.05 is considered statistically significant as determined by two-way ANOVA followed by Bonferroni post-test comparing treated cells to control.
Abbreviations: NPs, nanoparticles; SEM, standard error of the mean; ANOVA, analysis of variance; MFI, mean fluorescence intensity; LPS, lipopolysaccharide; h, hours.
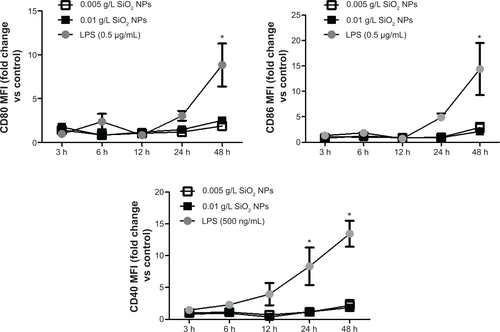
Figure S7 Evaluation of phagocytosis in bone marrow-derived primary macrophages.
Notes: (A) Representative confocal and overlay images showing cell outline, nuclei (gray), and E. coli incorporation (black). (B) Summary of confocal analysis represented in (A). (C) Corresponding flow cytometry analysis for same data set.
Abbreviations: NP, nanoparticle; LPS, lipopolysaccharide.
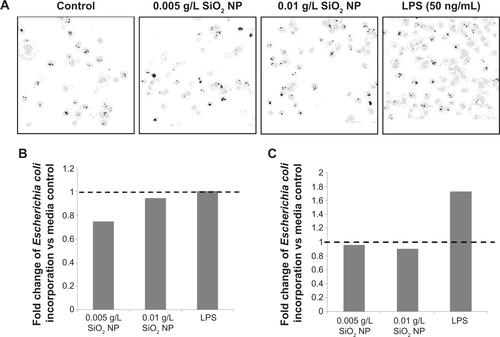
Table S1 DLS data of NPs dispersed in cell culture media