Figures & data
Figure 1 Peptide (IK8L) decreased mortality rates and disease severity in Kp-infected mice.
Notes: (A) Whole animal imaging of bioluminescence was obtained using IVIS XRII system at different time points. Sham- and IK8L-treated mice were infected with 1×10⁵ CFU of Kp Xen-39 by nasal cavity (Caliper) (arrows indicating Kp spread regions). (B) Kaplan–Meier survival curves were obtained (P=0.0455; 95% confidence interval: 1.041 to 52.46, log-rank test). (C) Bacterial burdens (CFU) of Kp-infected mice treated with IK8L or control at different times. In (A), data are shown as mean ± SD/SEM of n=4 mice per group; (A–C) are representative of four mice per group. ***P<0.001; Mann–Whitney U-test.
Abbreviations: CFU, colony-forming units; h, hours; Kp Xen-39, ; Max, maximum; Min, minimum; RLU, relative LUC units; LUC, luminescence unit counts; SD, standard deviation; SEM, standard error of the mean.
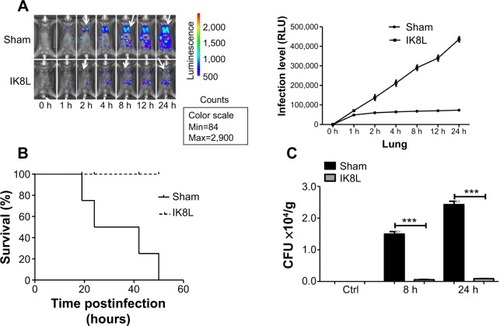
Figure 2 IK8L increased AM viability in Kp-infected mice.
Notes: (A) Cell viability was determined in AMs by MTT assay. AM cells were obtained separately from infected mice and IK8L-treated mice. The absorbance of each sample was recorded at 560 nm to determine the cell viability rate. (B) Scattered distribution graph of apoptotic staining of the AM cells with or without IK8L treatment. The data of apoptotic percentage of treated cells vs the control are representative of two experiments (arrows indicating the apoptotic levels). (C and D) PMN infiltration in the BAL and blood was counted by Hema staining (Thermo Fisher, Waltham, MA, USA). (E) Superoxide production in AM cells detected using an NBT assay. (F) Oxidative stress in AM cells was determined by H2DCF assay. Data are shown as mean ± SEM of n=3 samples and are representative of three independent experiments. **P<0.01; ***P<0.001; one-way ANOVA (Tukey’s post hoc).
Abbreviations: AM, alveolar macrophage; ANOVA, analysis of variance; BAL, bronchoalveolar lavage; h, hours; H2DCF, dihydrodichlorofluorescein diacetate; Kp, Klebsiella pneumoniae; MTT, 3-(4,5-dimethyl-2-thiazolyl)-2,5 diphenyltetrazolium bromide; NBT, nitroblue tetrazolium; PMN, polymorphonuclear neutrophil; Q, quarter; RFU, relative fluorescence units; RLU, relative LUC units; SEM, standard error of the mean.
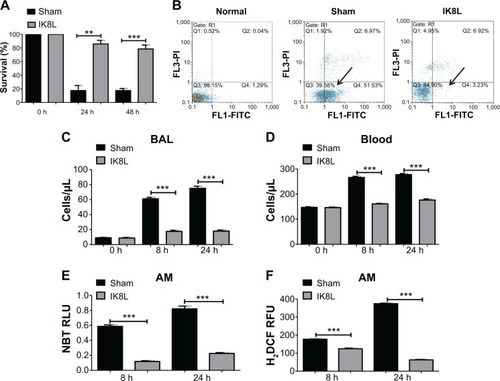
Figure 3 IK8L decreased infection-induced tissue injury.
Notes: (A) Morphological evidence of lung injury and inflammatory responses as assessed by H&E staining histological analysis (20×, scale bar =50 μm, inset shows the typical tissue injury and inflammatory influx). (B–E) Decreased MPO in the lung, kidney, spleen, and liver of IK8L-treated mice. Data are shown as mean ± SEM of n=3 mice per group and are representative of three independent experiments. *P<0.05; **P<0.01; ***P<0.001; one-way ANOVA (Tukey’s post hoc).
Abbreviations: ANOVA, analysis of variance; h, hours; H&E, hematoxylin and eosin; MPO, myeloperoxidase; RLU, relative LUC units; SEM, standard error of the mean.
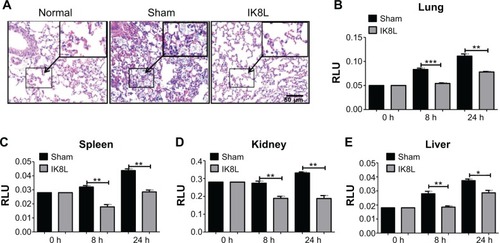
Figure 4 IK8L killed Kp by blocking biofilm formation.
Notes: (A) Biofilm formation assessed by crystal violet staining of biofilms grown in microtiter wells for 8 hours. (B) Quantification of staining of wells in (A) after solubilization with acetic acid and measurement of OD550. (C) CFU per well of biofilm bacteria.
Abbreviations: CFU, colony-forming units; Kp, Klebsiella pneumoniae; OD550, optical density at 550 nm.
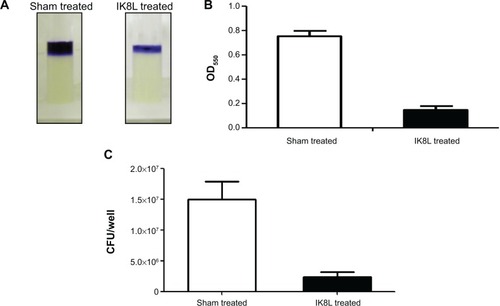
Figure 5 IK8L modulated Kp-induced inflammatory reaction via the IL-6/JAK/STAT3 signaling pathway.
Notes: (A–C) ELISA was used to measure IL-6, TNF-α and IL-1β in BAL fluids of mice 8 hours and 24 hours post infection, respectively. (D) Cell signaling proteins relating to the JAK2/STAT3 signaling pathway were evaluated in lung tissue by Western blotting analysis. (E) Expression and phosphorylation of signaling proteins relating to NF-κB transcription factor were evaluated in lung tissue by Western blotting. (F) Cell signaling proteins relating to the AKT signaling pathway were evaluated by Western blot. β-actin was used as a loading control. Data are shown as mean ± SEM of n=3 mice per group and are representative of three independent experiments. *P<0.05; **P<0.01; ***P<0.001; one-way ANOVA (Tukey’s post hoc).
Abbreviations: ANOVA, analysis of variance; BAL, bronchoalveolar lavage; ELISA, enzyme-linked immunosorbent assay; IL, interleukin; Kp, Klebsiella pneumoniae; SEM, standard error of the mean; TNF-α, tumor necrosis factor alpha; p, phosphorylation.
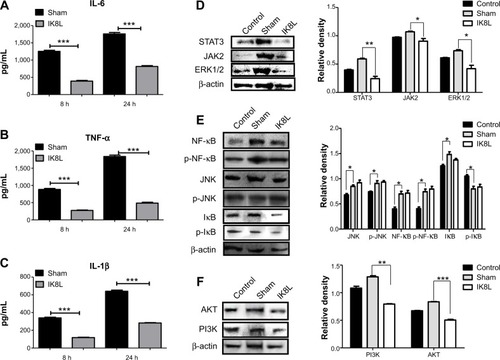
Figure 6 STAT3 signaling pathway played a crucial role in IK8L antibacterial function.
Notes: (A) Superoxide production in MH-S cells significantly increased by blocking STAT3 with an inhibitor, compared to controls before peptide treatment using an NBT assay (1 mg/mL). The data were recorded at 560 nm absorbance. (B) Oxidative stress was increased by blocking STAT3 compared to controls before peptide treatment as determined by the H2DCF assay (5 μM). The fluorescence was quantified at 488 nm. (C) MTT assay indicated decreased cell viability of blocking STAT3 in MH-S cells compared to controls before peptide treatment. (D) Confocal fluorescence microscopy image showing Kp distributions and lipid raft staining using CTB chain (arrows indicating internalized Kp, scale bar =20 μm). (E) Quantification of colocalization between Kp and lipid raft from D, and expressed relative to sham-treated cell. (F) Bacterial burdens (CFU) of Kp-infected cells treated with IK8L and STAT3 inhibitor. The data are mean ± SEM and are representative of three independent experiments (one-way ANOVA [Tukey’s post hoc]; asterisk compared with control; **P<0.01; ***P<0.001).
Abbreviations: ANOVA, analysis of variance; CFU, colony-forming units; CTB, cholera toxin B; RLU, relative LUC units; H2DCF, dihydrodichlorofluorescein diacetate; Kp, Klebsiella pneumoniae; MH-S, murine alveolar macrophage cell line; MTT, 3-(4,5-dimethyl-2-thiazolyl)-2,5-diphenyltetrazolium bromide; NBT, nitroblue tetrazolium; RFU, relative fluorescence units; SEM, standard error of the mean; DIC, differential interference contrast.
![Figure 6 STAT3 signaling pathway played a crucial role in IK8L antibacterial function.Notes: (A) Superoxide production in MH-S cells significantly increased by blocking STAT3 with an inhibitor, compared to controls before peptide treatment using an NBT assay (1 mg/mL). The data were recorded at 560 nm absorbance. (B) Oxidative stress was increased by blocking STAT3 compared to controls before peptide treatment as determined by the H2DCF assay (5 μM). The fluorescence was quantified at 488 nm. (C) MTT assay indicated decreased cell viability of blocking STAT3 in MH-S cells compared to controls before peptide treatment. (D) Confocal fluorescence microscopy image showing Kp distributions and lipid raft staining using CTB chain (arrows indicating internalized Kp, scale bar =20 μm). (E) Quantification of colocalization between Kp and lipid raft from D, and expressed relative to sham-treated cell. (F) Bacterial burdens (CFU) of Kp-infected cells treated with IK8L and STAT3 inhibitor. The data are mean ± SEM and are representative of three independent experiments (one-way ANOVA [Tukey’s post hoc]; asterisk compared with control; **P<0.01; ***P<0.001).Abbreviations: ANOVA, analysis of variance; CFU, colony-forming units; CTB, cholera toxin B; RLU, relative LUC units; H2DCF, dihydrodichlorofluorescein diacetate; Kp, Klebsiella pneumoniae; MH-S, murine alveolar macrophage cell line; MTT, 3-(4,5-dimethyl-2-thiazolyl)-2,5-diphenyltetrazolium bromide; NBT, nitroblue tetrazolium; RFU, relative fluorescence units; SEM, standard error of the mean; DIC, differential interference contrast.](/cms/asset/f8f06702-ac8d-497e-bdef-5148e9ae0c17/dijn_a_73303_f0006_c.jpg)
Figure 7 Schematic diagram showing how IK8L regulates the JAK/STAT3 pathway and counteracts the Klebsiella infection, especially through modulation of inflammatory responses.
Abbreviations: IL, interleukin; Kp, Klebsiella pneumoniae.
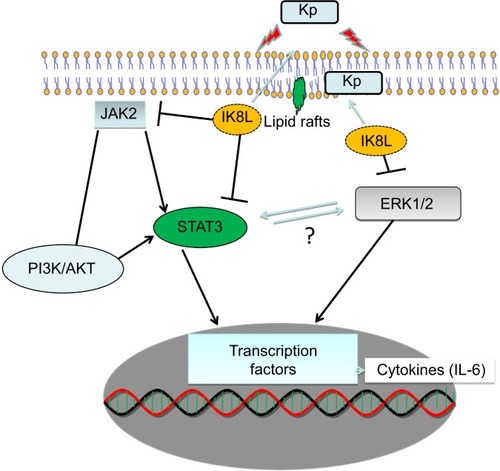
Figure S1 IK8L decreased the dissemination of infection.
Notes: (A–C) The liver, spleen, and kidneys showed significantly decreased bacterial burdens after infection with Kp in IK8L-treated mice compared with sham-treated mice. IK8L-treated mice and sham-treated mice were infected with 1×10⁵ CFU/mouse Kp at 8 and 24 hours. Fresh tissues were homogenized in PBS. The same amounts of tissue were evaluated for testing bacterial colonies and the unit is CFU/g. The data are representative of four mice per group. ***P<0.001; Mann–Whitney U-test.
Abbreviations: CFU, colony-forming unit; Ctrl, control; h, hours; Kp, Klebsiella pneumoniae; PBS, phosphate-buffered saline.
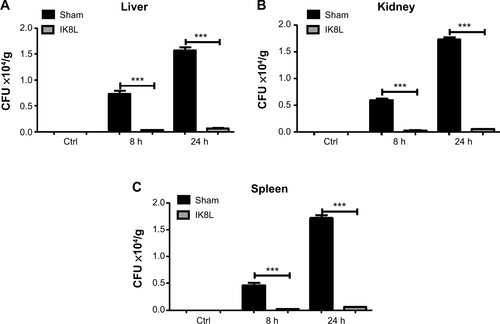
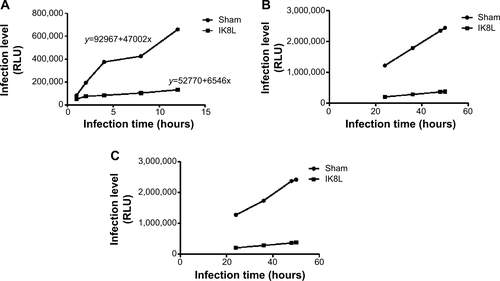
Figure S2 Prediction of infection with time using the mathematical model.
Notes: (A) Data obtained from in vivo imaging were quantified using relative LUC units of the two groups in sham-treated and IK8L-treated mice at 1 hour, 2 hours, 4 hours, 8 hours, and 12 hours. Sham- and IK8L-treated mice were infected with 1×10⁵ CFU/mouse of Kp Xen-39 by nasal cavity. Semiquantitatively, bioluminescence intensity was obtained using IVIS XRII software. Regression equation was calculated using SPSS software calculations. (B) The data showing predicted relative LUC units of two groups according to two regression equations in (A) at 24 hours, 36 hours, 48 hours, and 50 hours according to our regression equation. (C) The data showing actual LUC units of the two groups in sham-treated and IK8L-treated mice at 24 hours, 36 hours, 48 hours, and 50 hours. Sham- and IK8L-treated mice were infected with 1×10⁵ CFU of Kp Xen-39 by nasal cavity.
Abbreviations: CFU, colony-forming units; LUC, luminescence unit counts.